


0
Data Driven Art

0
Sleep Clinic Data Art Collection
0
Butt Weight: There’s More!

0
Leave it to Beavers

0
Orienteering Belongs in the Olympics
1
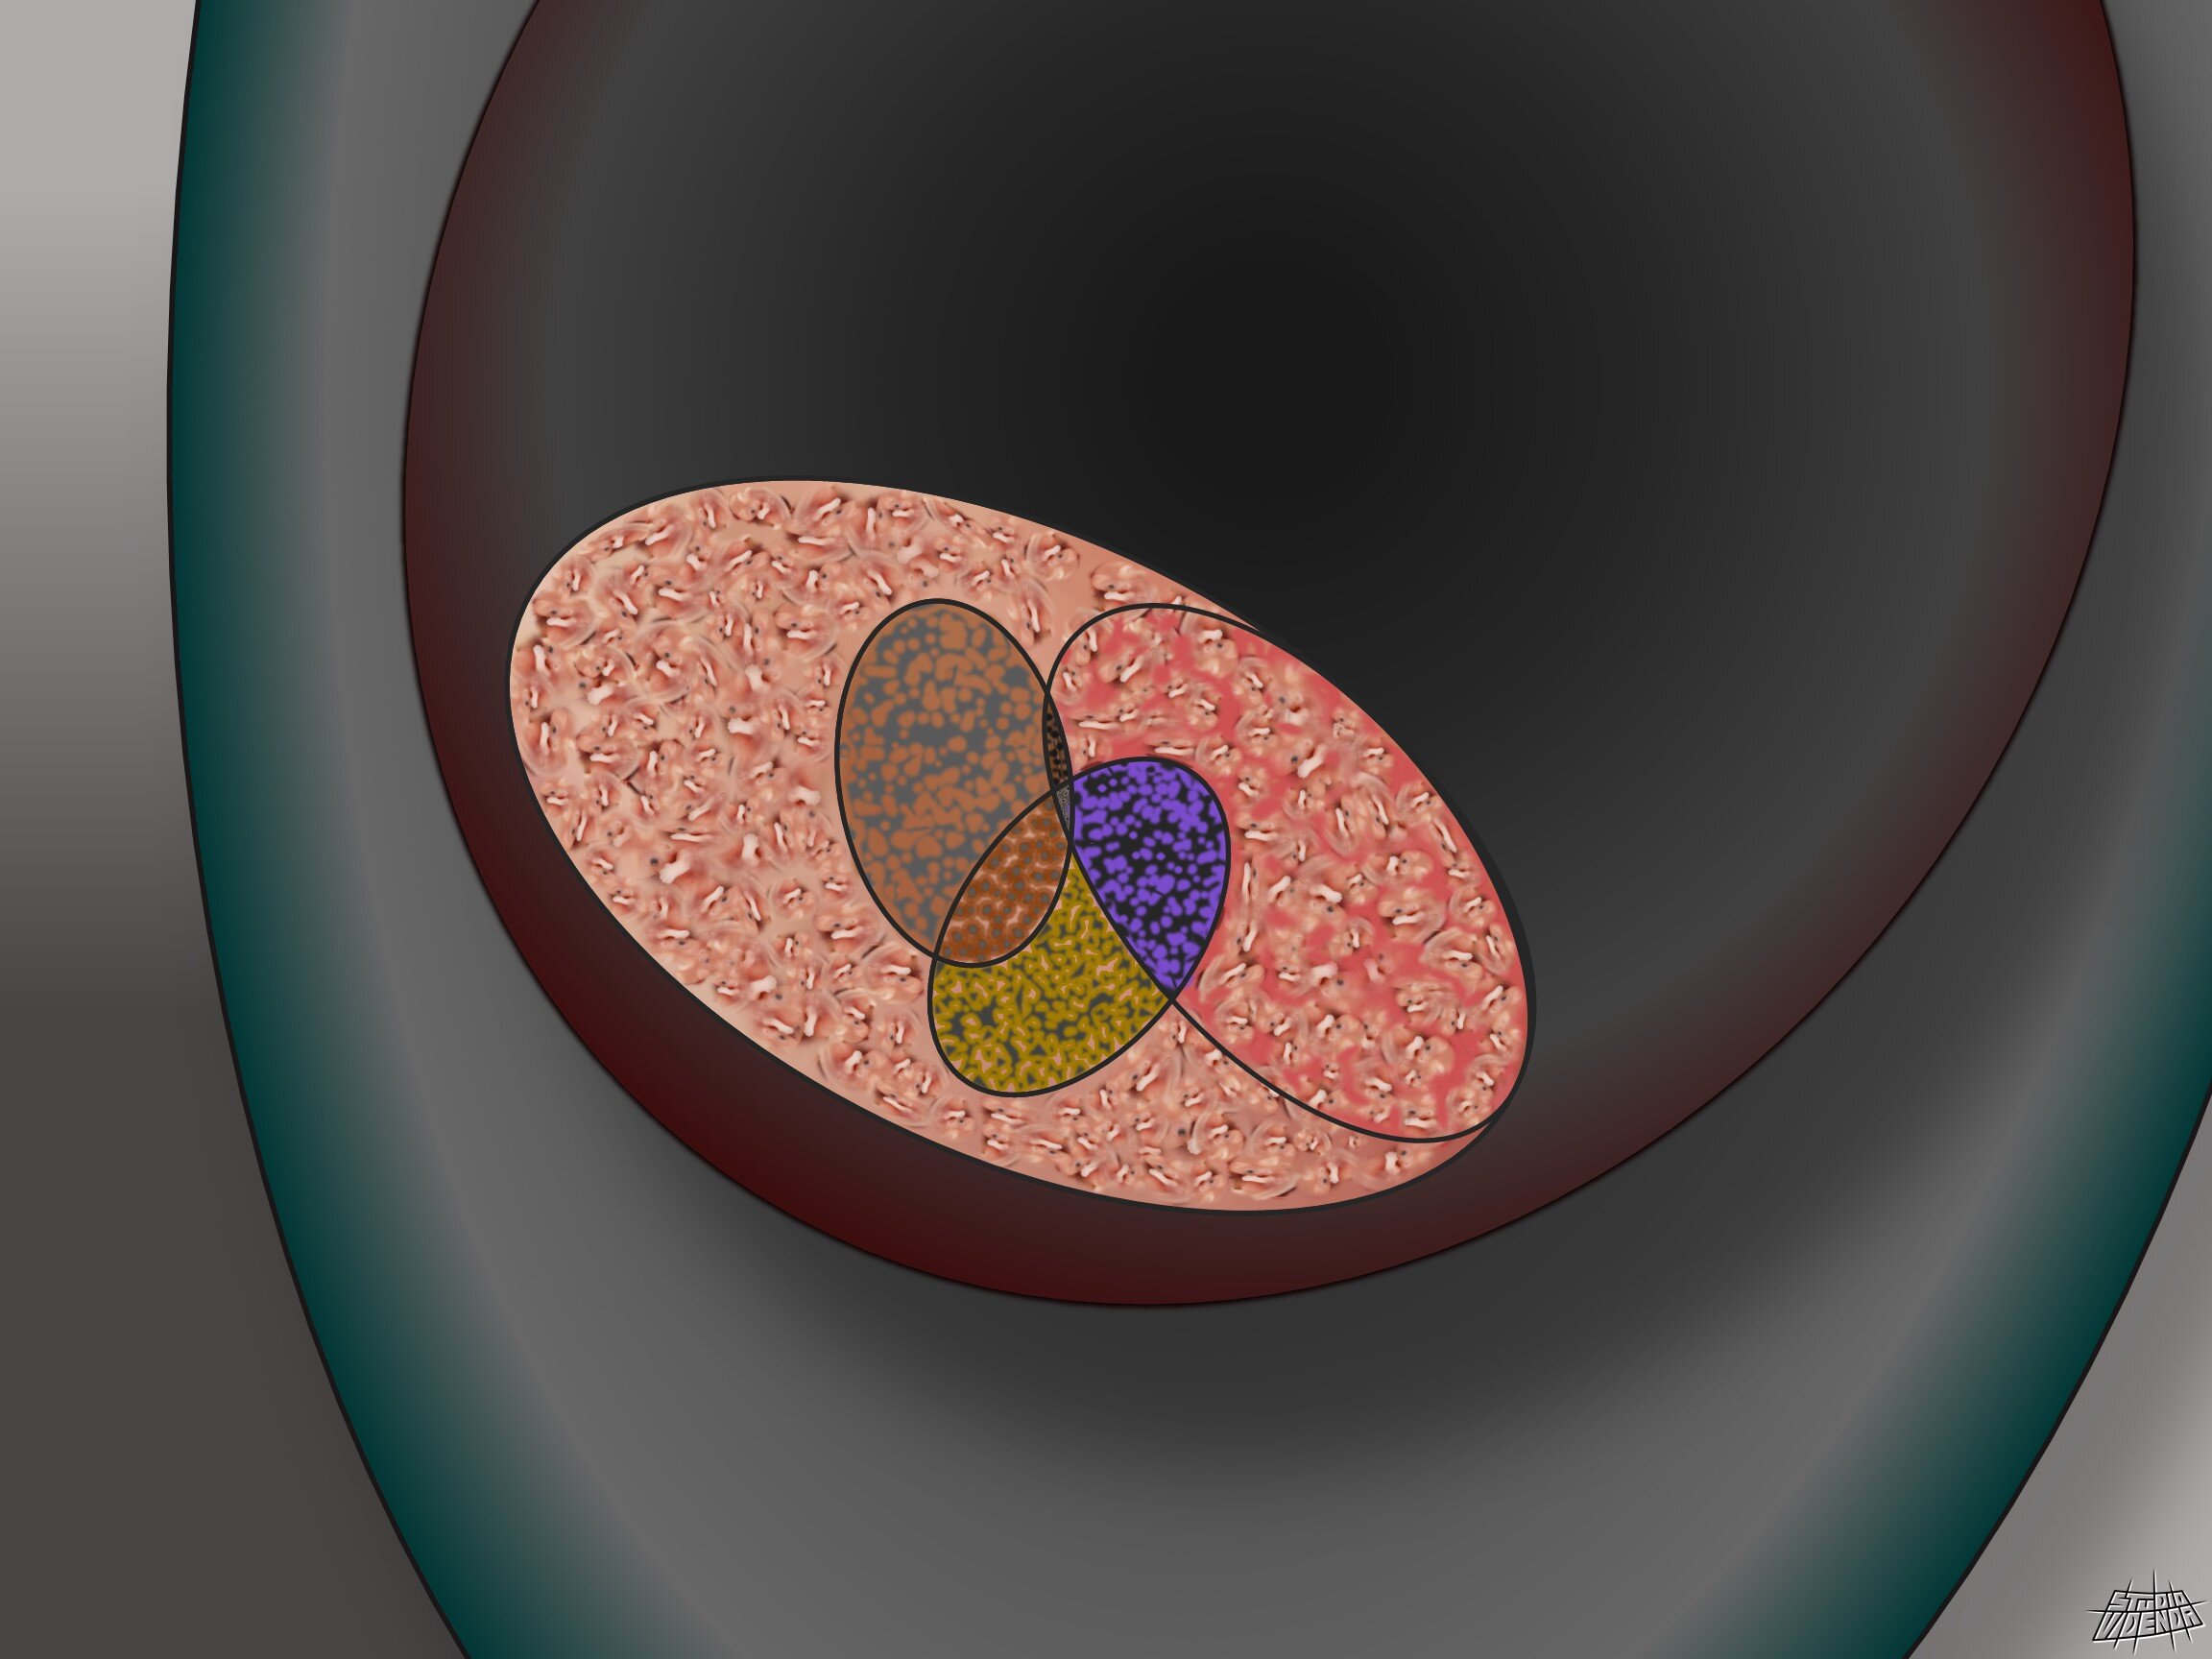
Anti-abortion women have abortions. How and Venn?

1
Hindsight is 2020

1
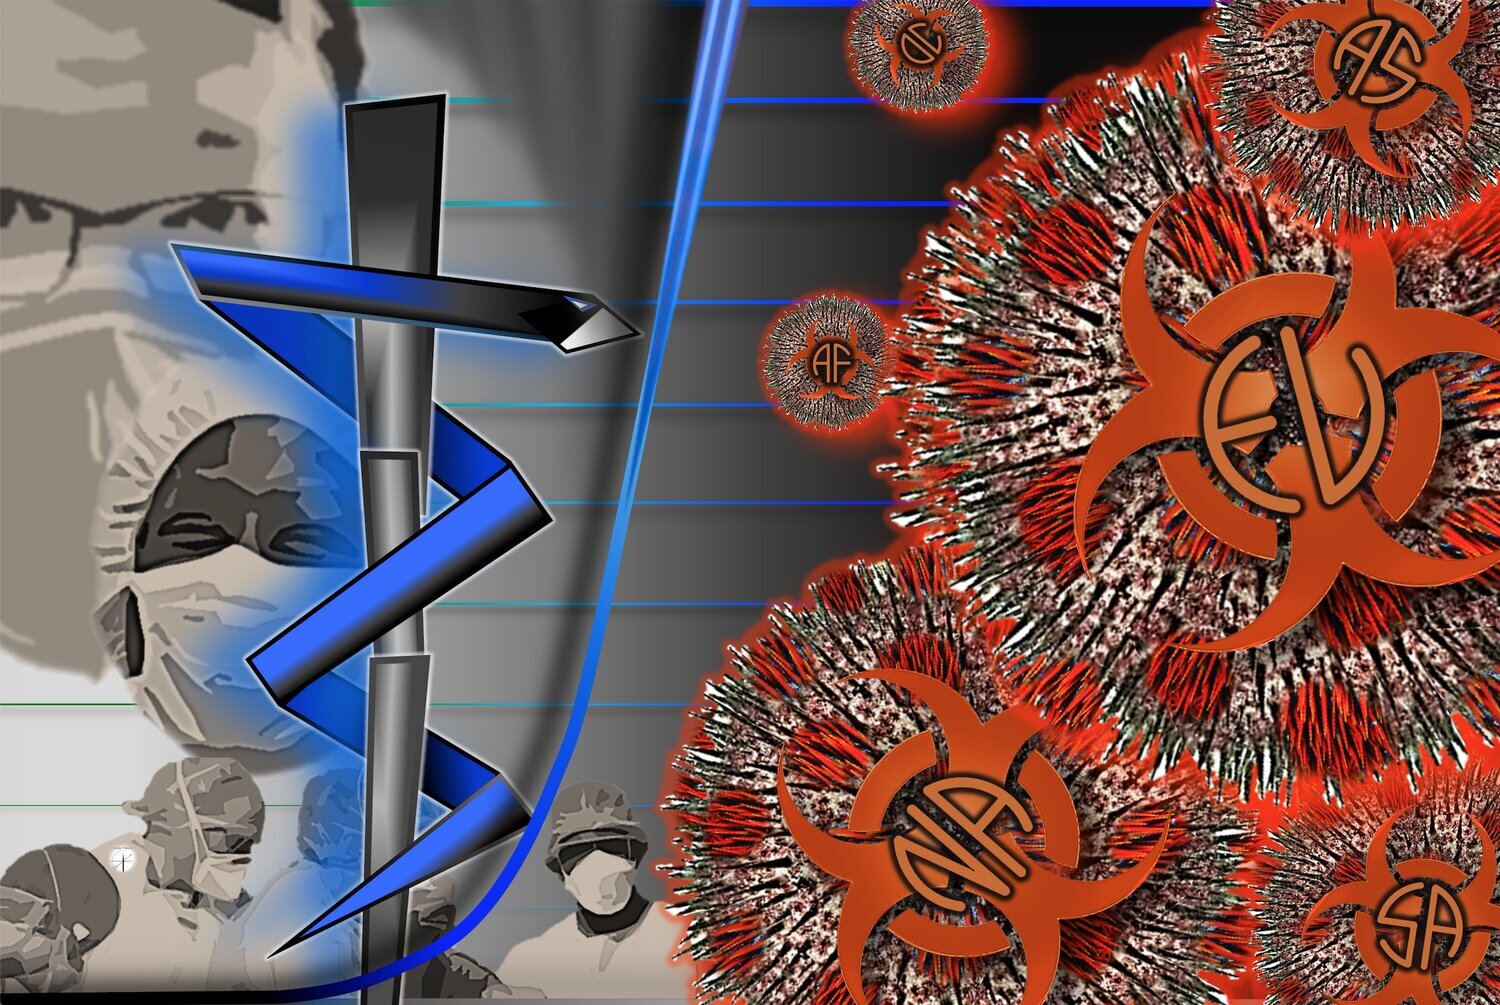
A COVID-19 Model
1
Many Died Poorly Protected to Protect Us

0
Rubbing Earth the Wrong Way

1
One Young Adult's Love Life

0
Geese Flying Over a Rural Texas Property

1
Smoked Gouda

1
Divider-in-Chief
0
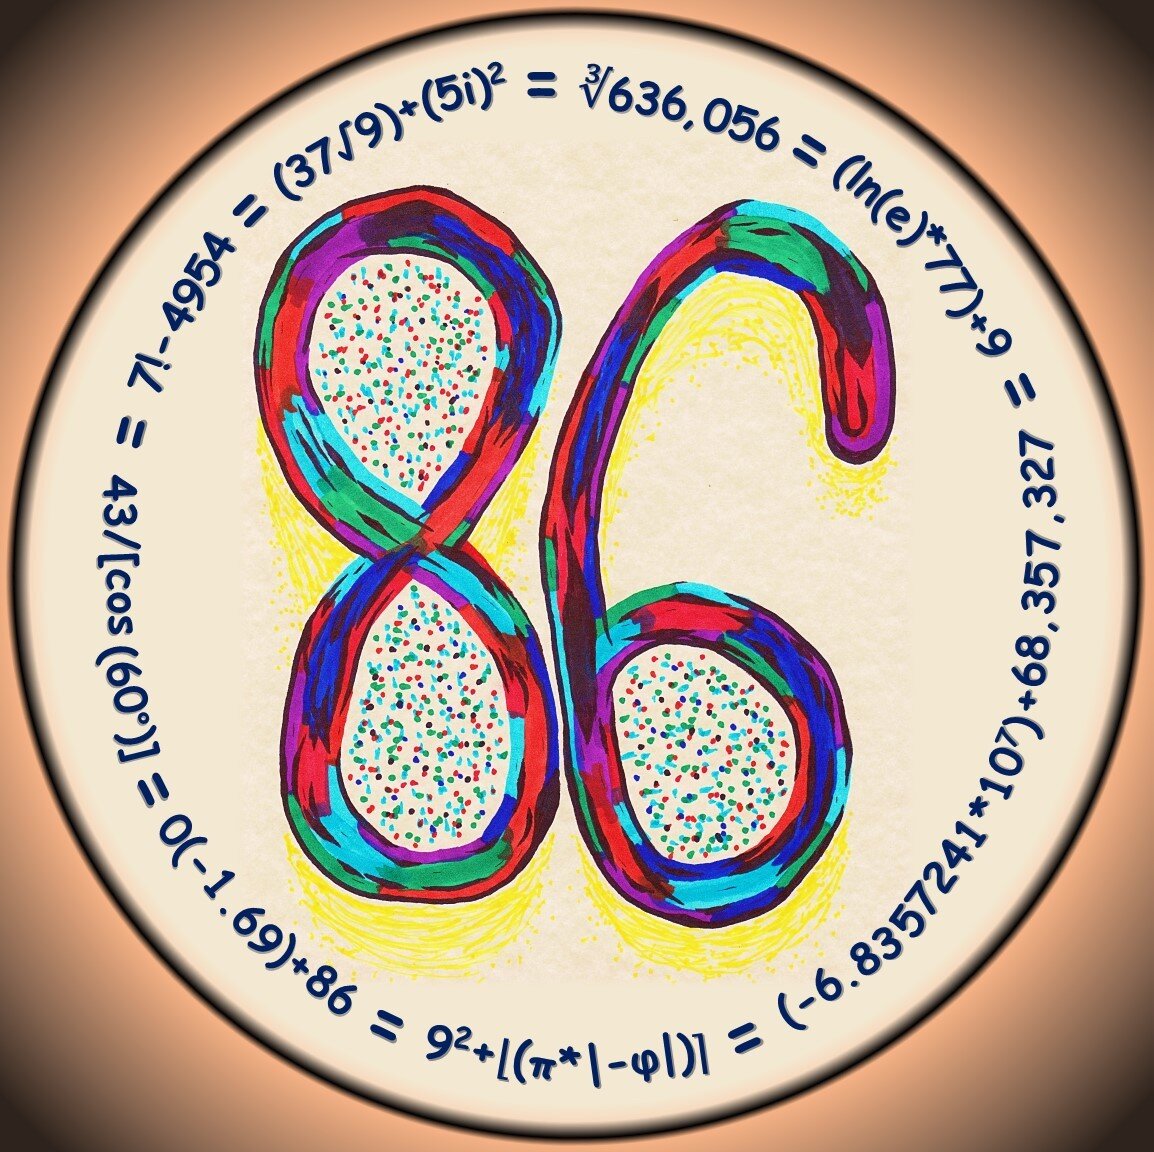
86

0
The Grandmother of Chaos
1
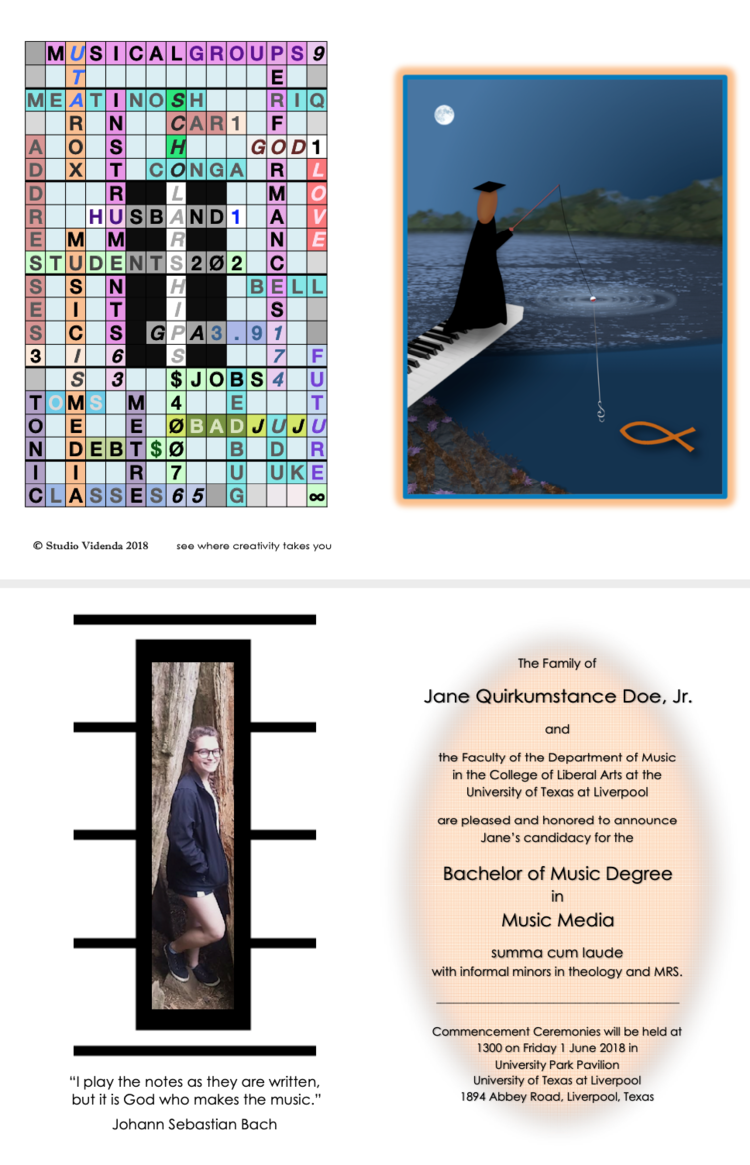
University Graduation Announcement

0
To Sleep, Perchance to Die. Or Kill.

1
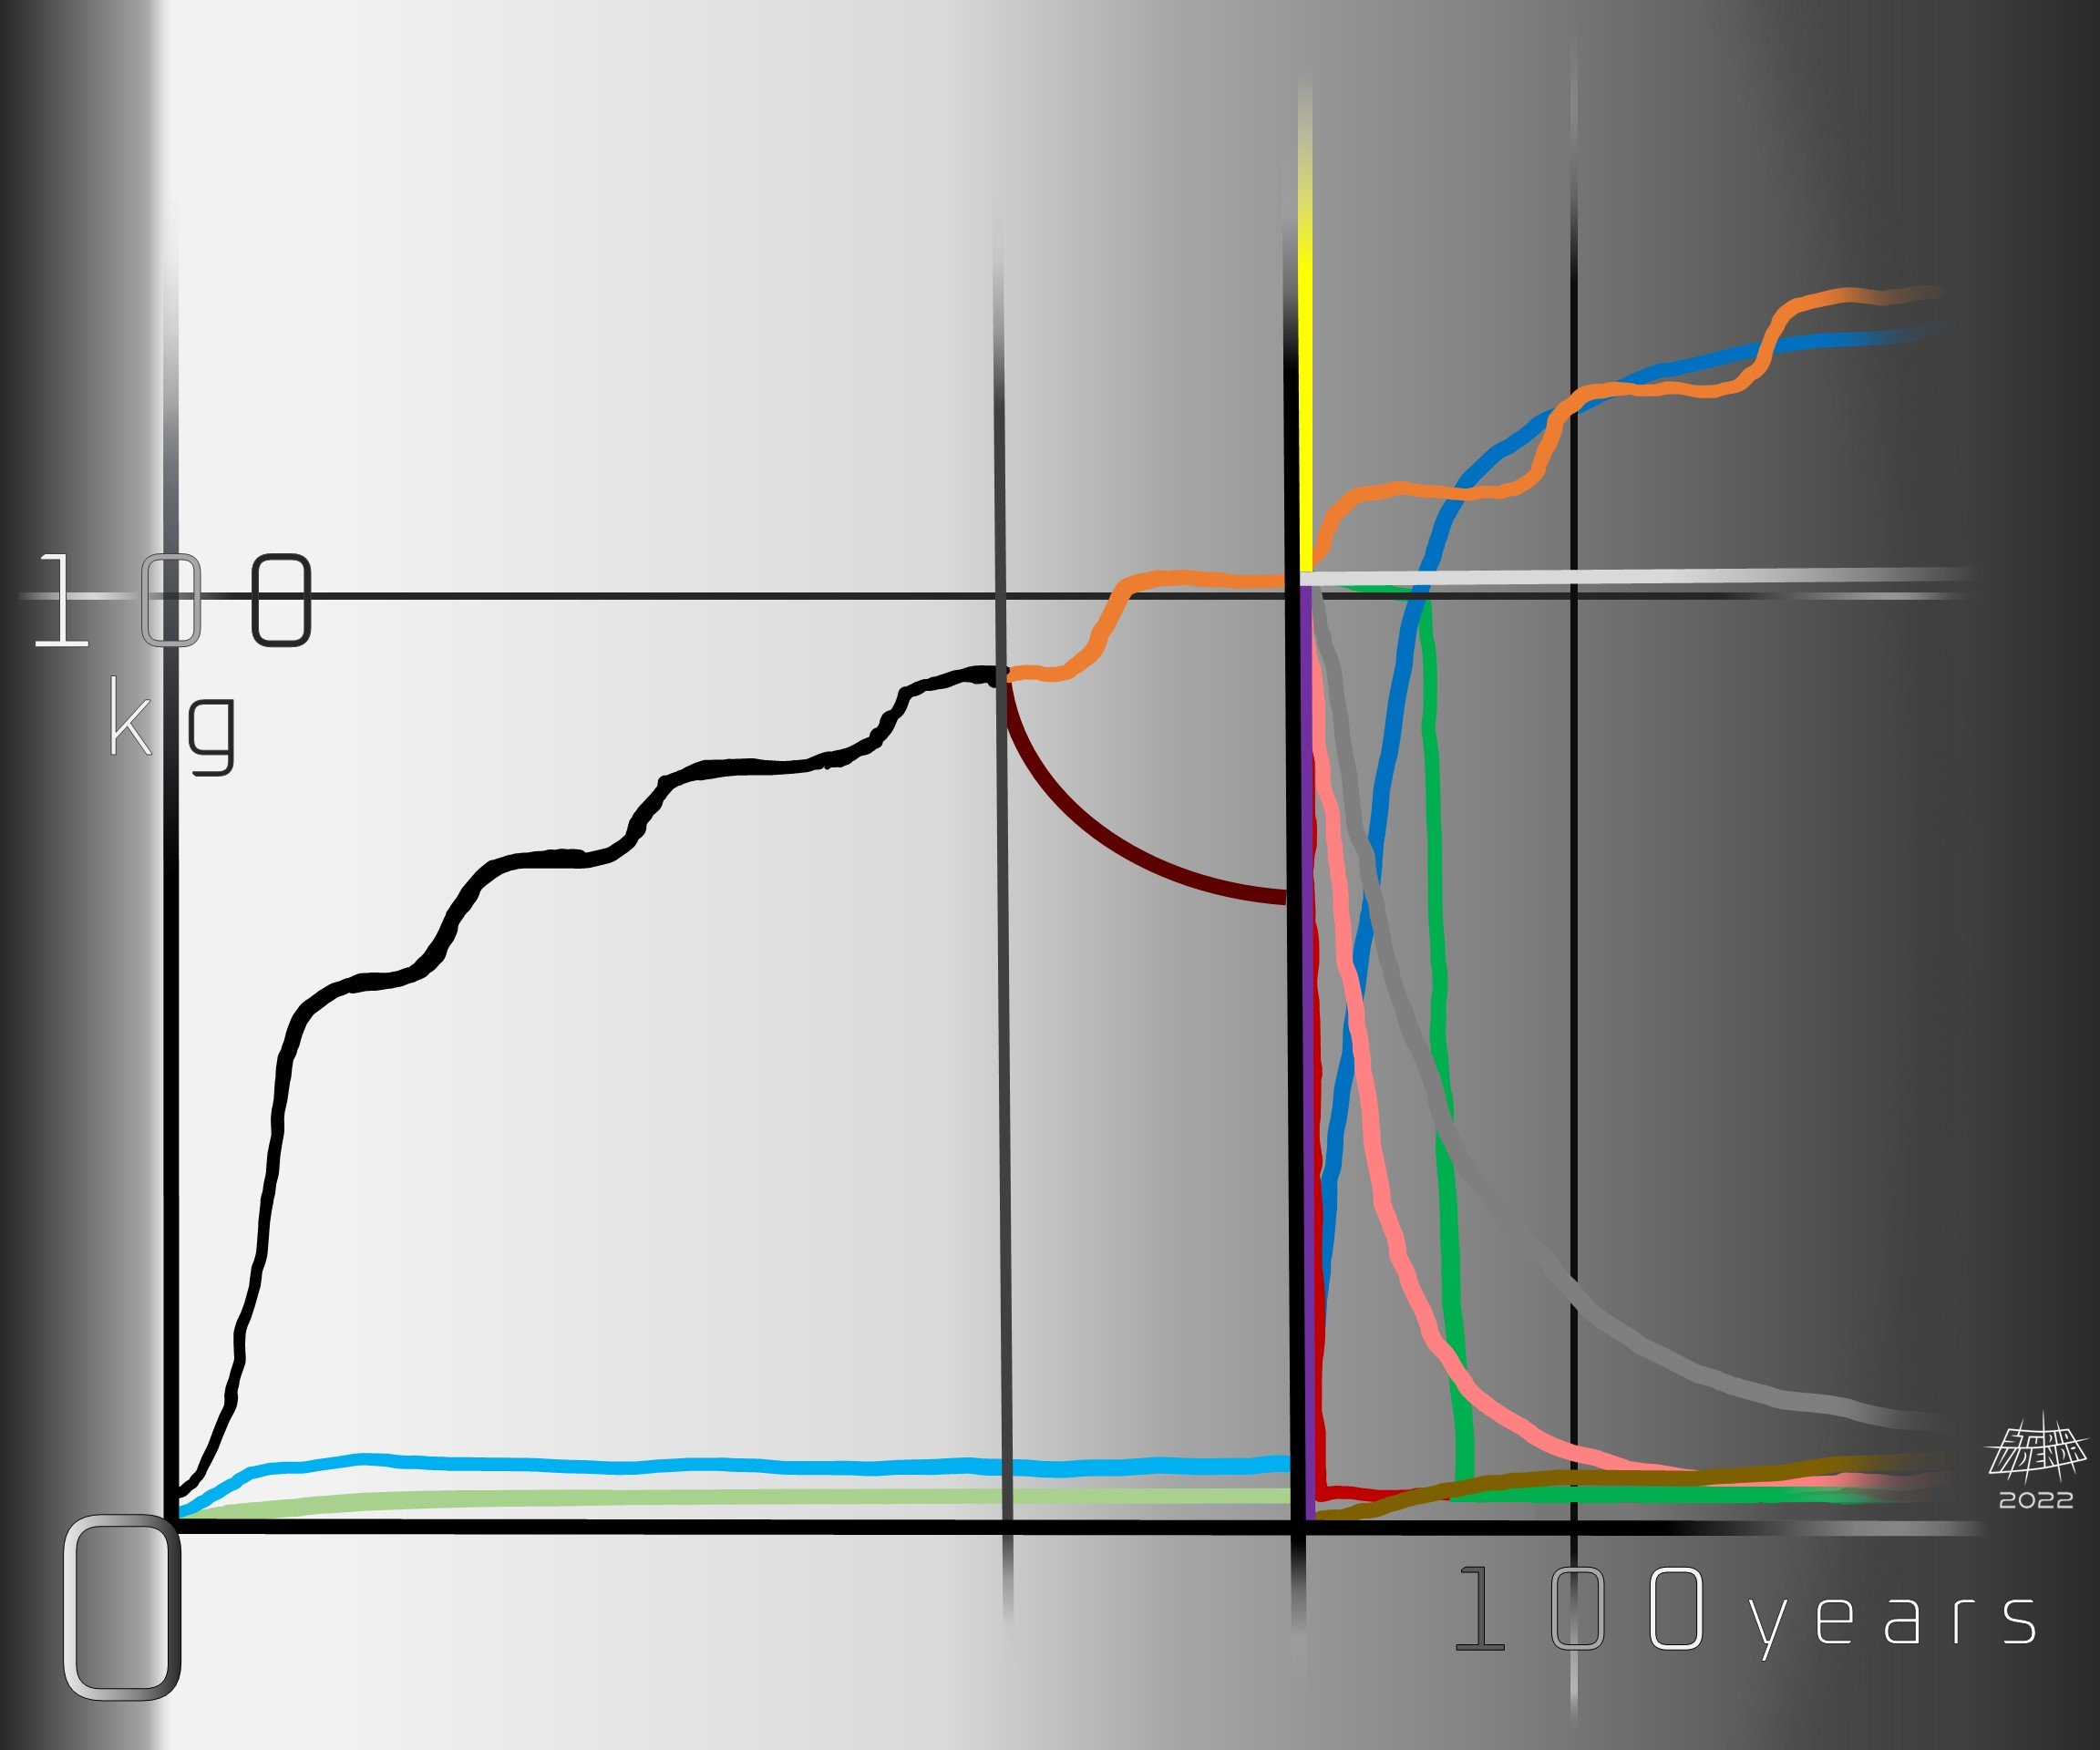
Cradle to Grave

1
The Unwanted Dance Partner

0
Constant Variables

0
Why is Patriarchy Still a Thing?

1
Kendra's Kidenda

0
Fractal Infographic: Sleep Apnea