Sleep Clinic Data Art Collection
We designed this collection for sleep medical clinics and labs, but most pieces could just as well grace other walls. The work draws from research and clinical sleep data, the written word, and our earlier sleep-related data art “To sleep, perchance … ” (https://www.studiovidenda.com/data-art#/sleep-apnea/). Color selection leans to the red end of the spectrum to avoid melatonin suppression from blue light, but some teals and other blueish hues sneak in.
Sleepy Word cloud
This minimalist word cloud says “sleepy” with just a few of its many synonyms. Word size correlates with number of Internet hits. Vertical positioning correlates with colloquial (“snoozy”) vs. technical usage (“somnolent”). For example, “snoozy” barely makes Scrabble dictionaries and would never appear in a research article. The vertically-oriented EEG signal shows brainwaves transitioning from wake to sleep.
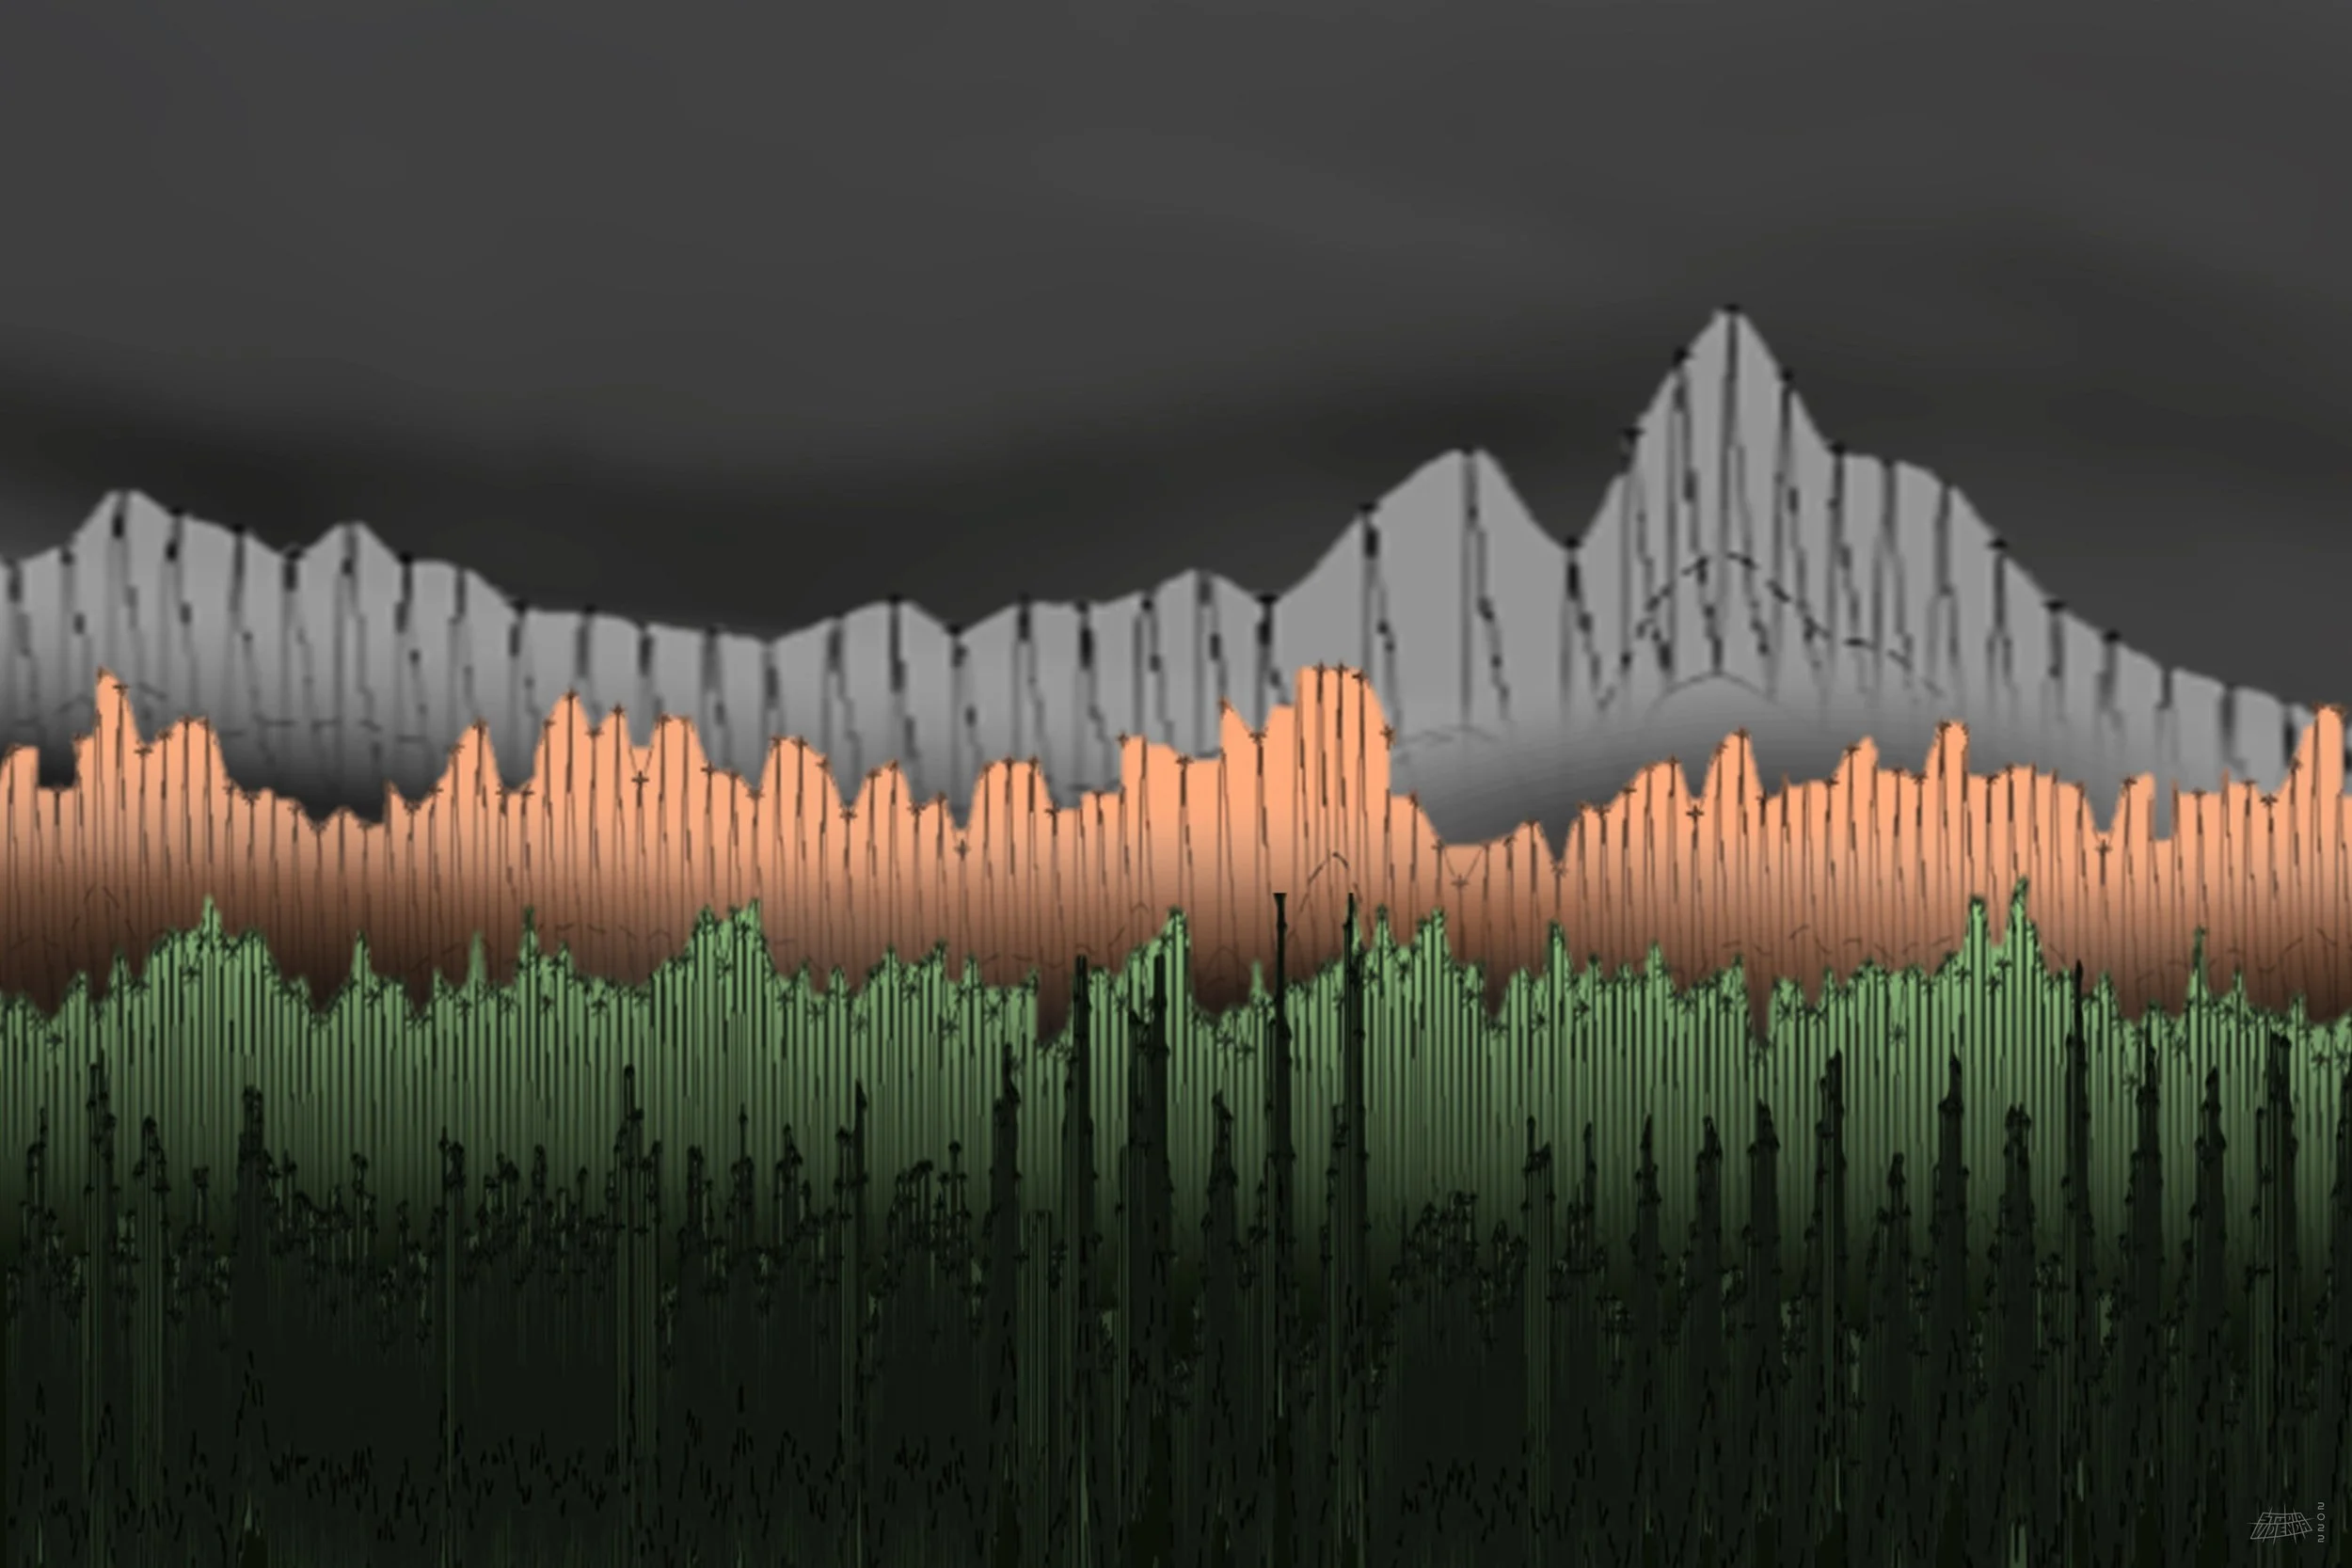
Cerebral Blood Flow Landscape
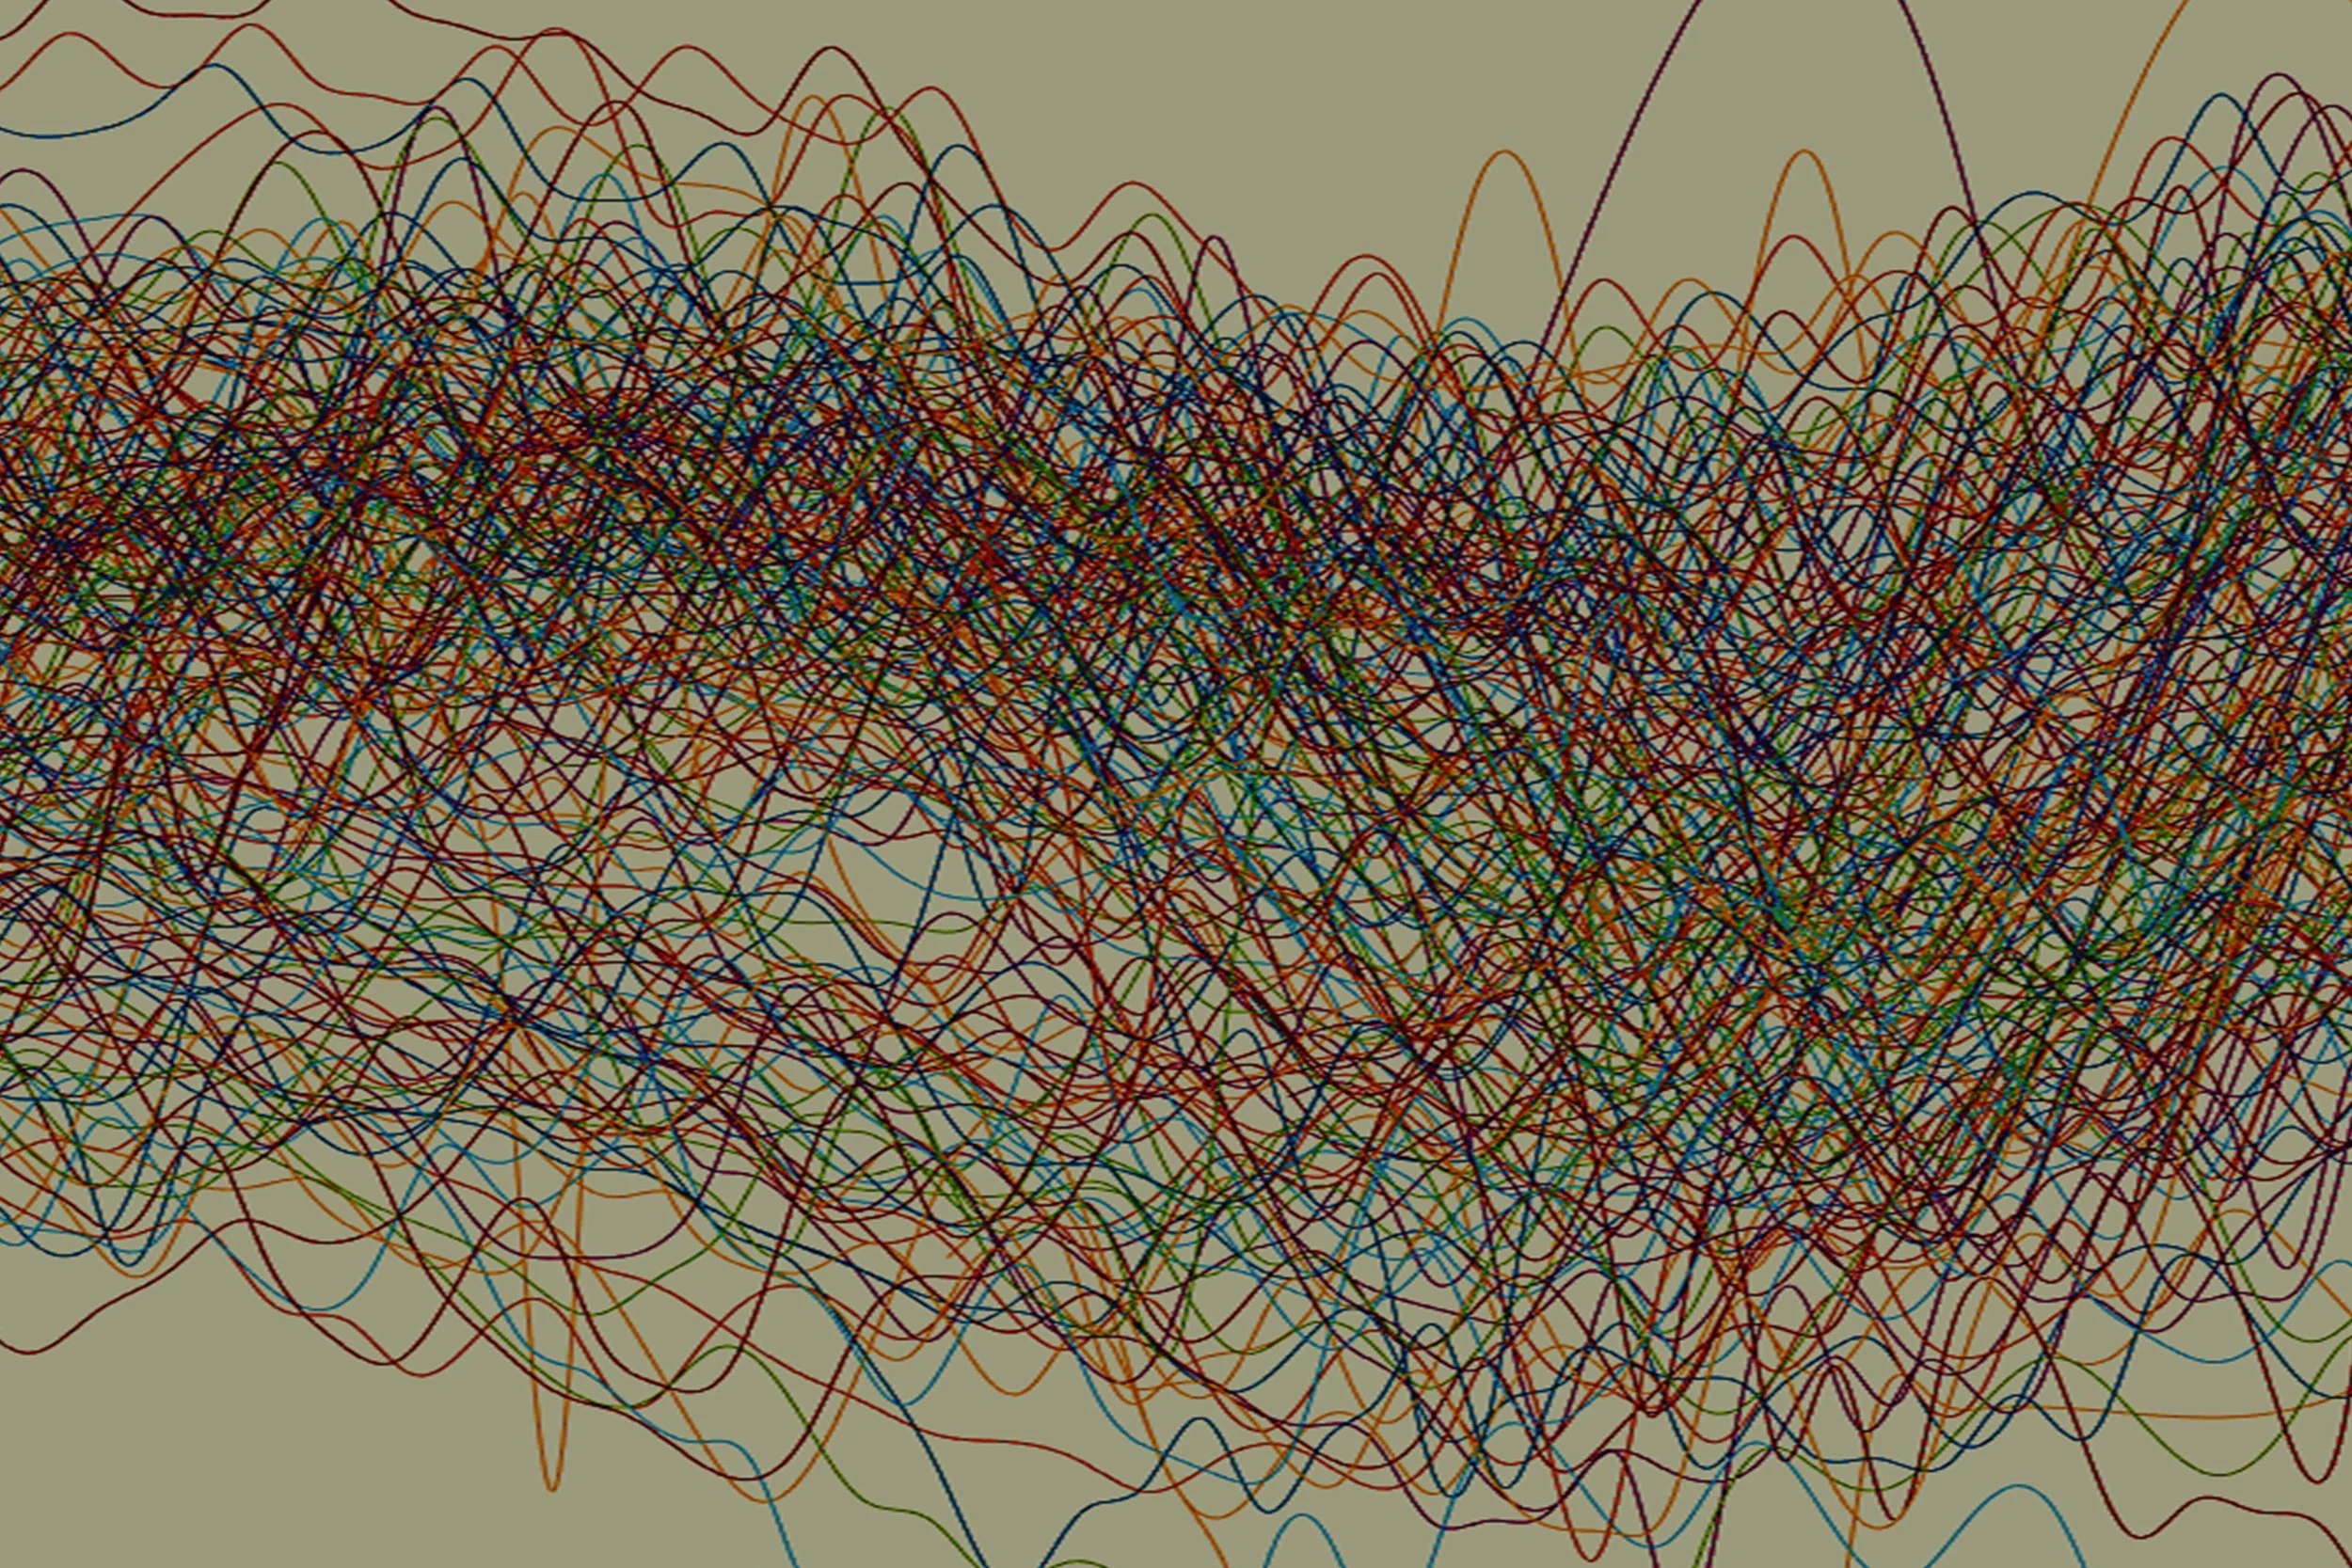
Sleep apnea corrupts cardiovascular physiology, including brain blood flow. This work creates a “signal landscape” from cerebral blood flow velocity (CBFV) data collected during sleep. Sleep breathing problems cause unhealthy changes in CBFV. This work reimagines those as landforms by manipulating time base and color. Four timescales of CBFV create the illusion of a landscape.
30 seconds - Jagged gray mountains in the background (NOTE: Don’t climb these “peaks” in your sleep);
90 seconds - Craggy brown rock slopes below mountains;
3 minutes - Forested slopes;
5 minutes - Dense forest at the base of the valley in the foreground.
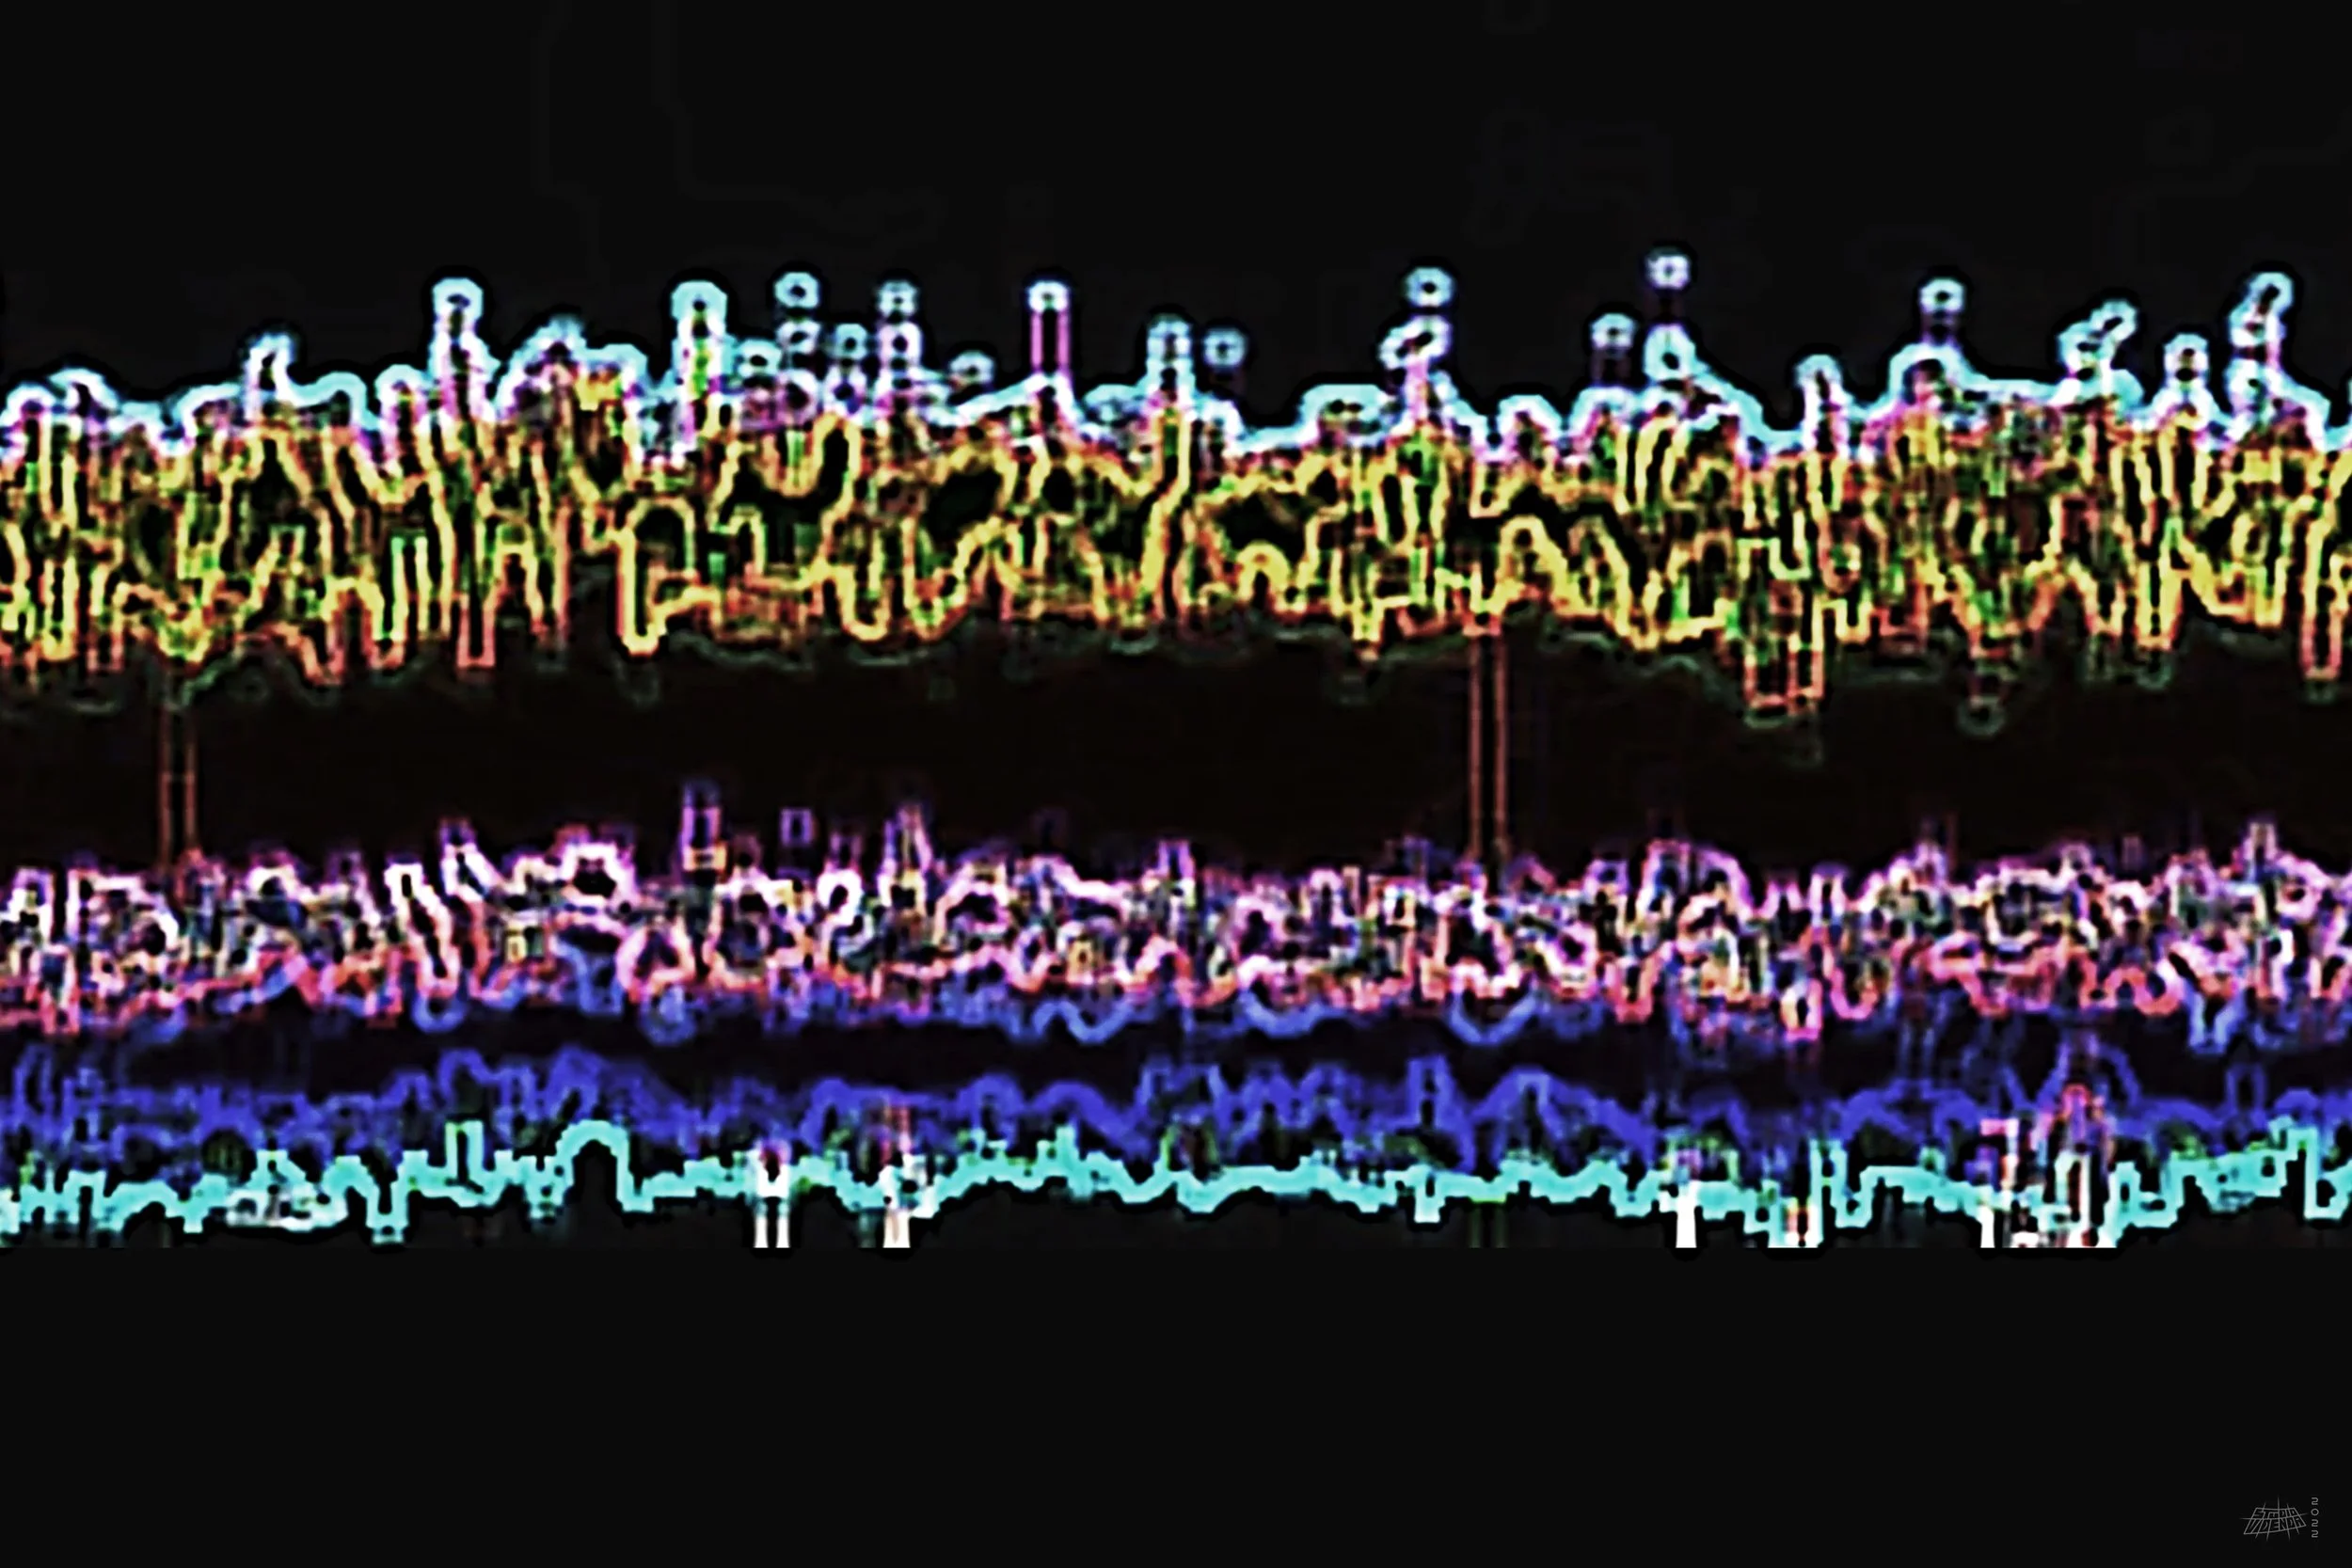
Colorized Sleepy BP
This work started as a continuous blood pressure signal (BP) during sleep. The signal was analyzed to quantify features such as lows, highs, and averages. Those features were color-coded. The result was placed on a dark background and further processed to achieve the final result.
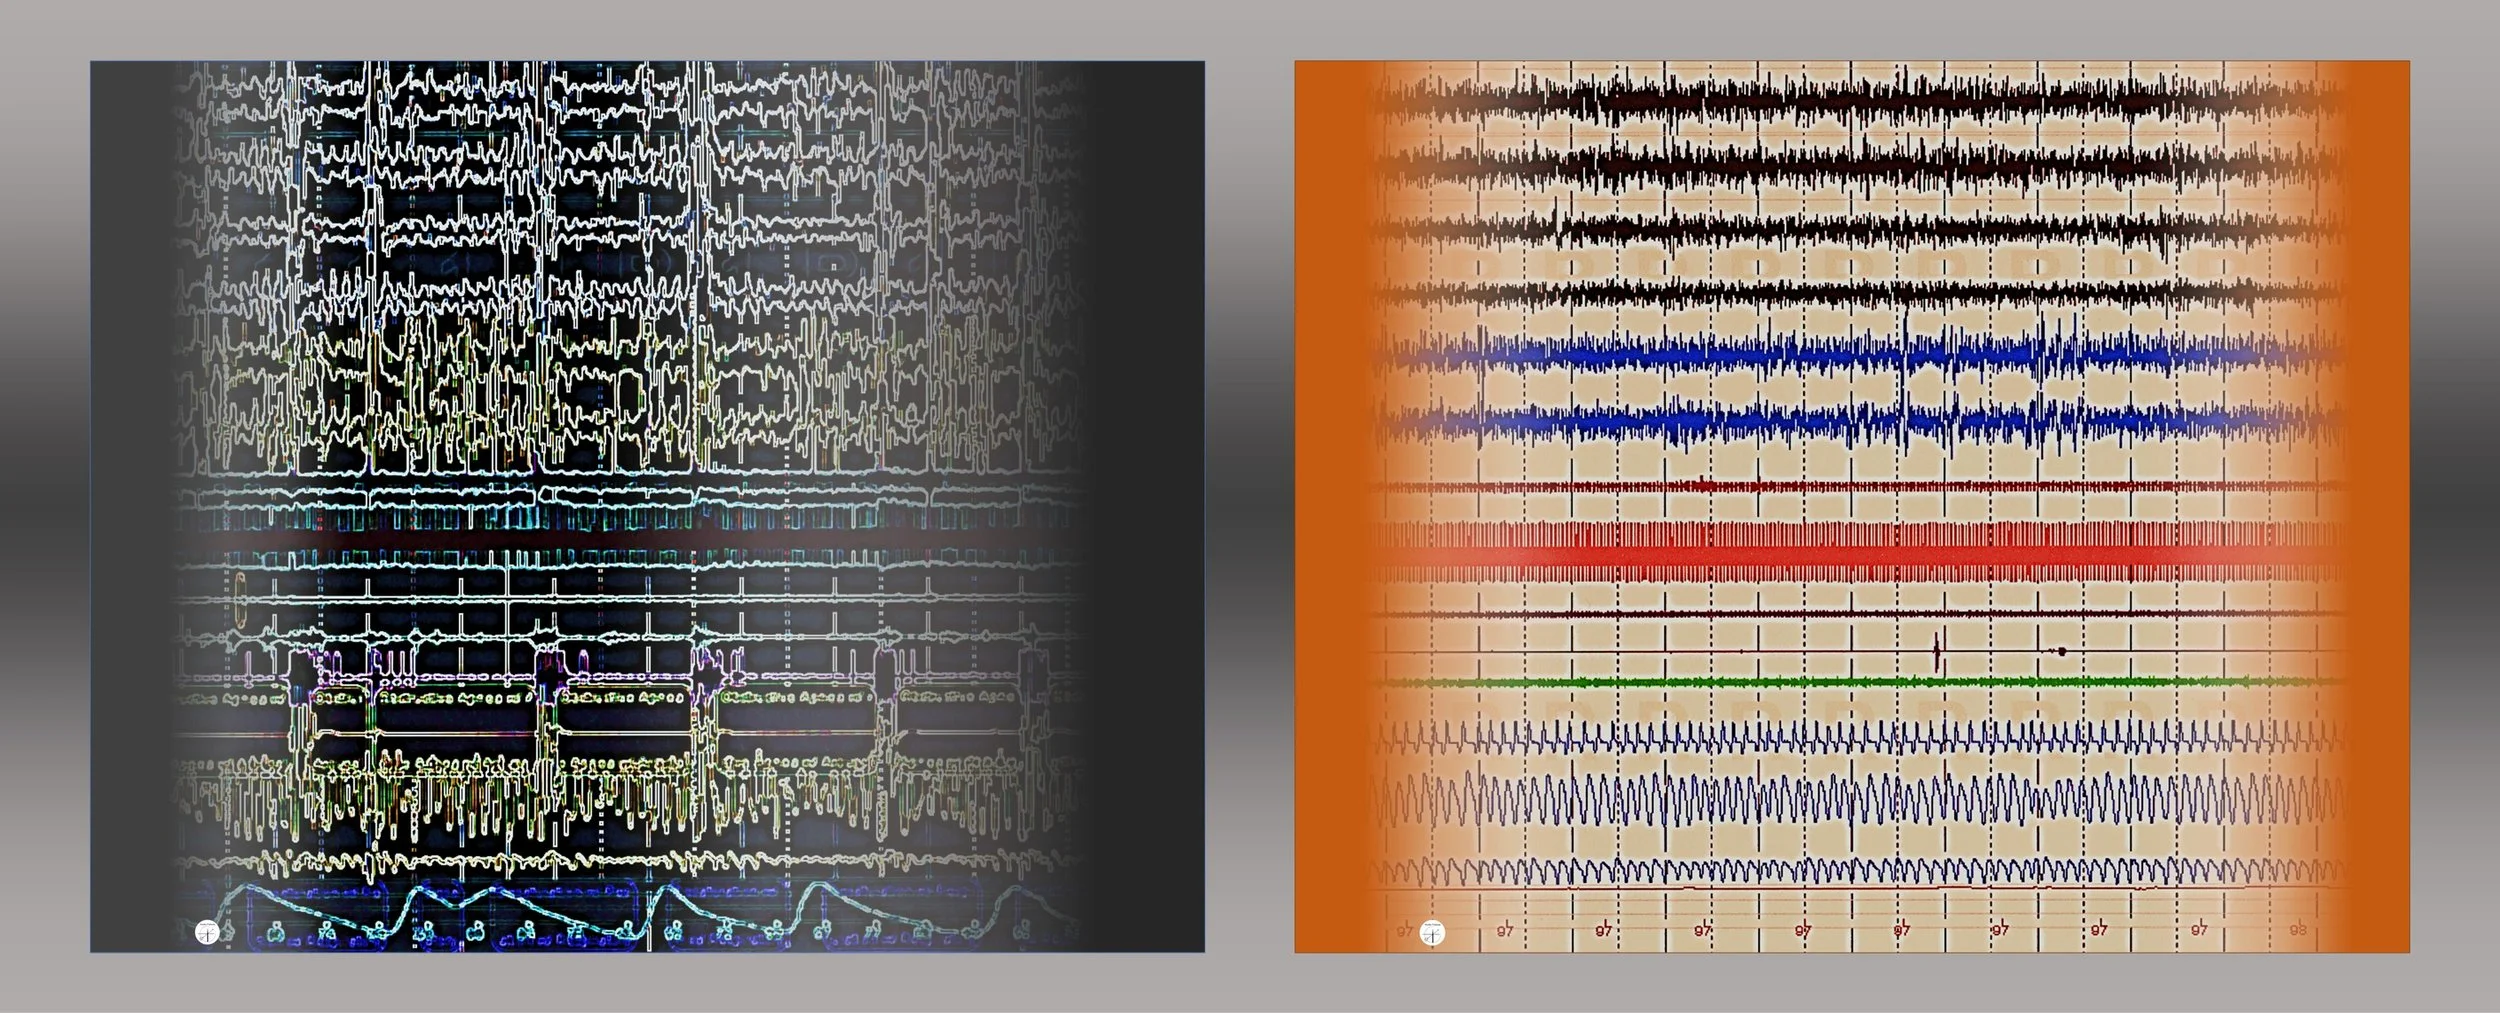
OSA Diptych
This pairing shows a few minutes of sleep for someone with severe obstructive sleep apnea in two conditions: untreated (left panel) and treated with positive airway pressure (PAP) therapy (right panel). You want your sleep to look like the right panel.
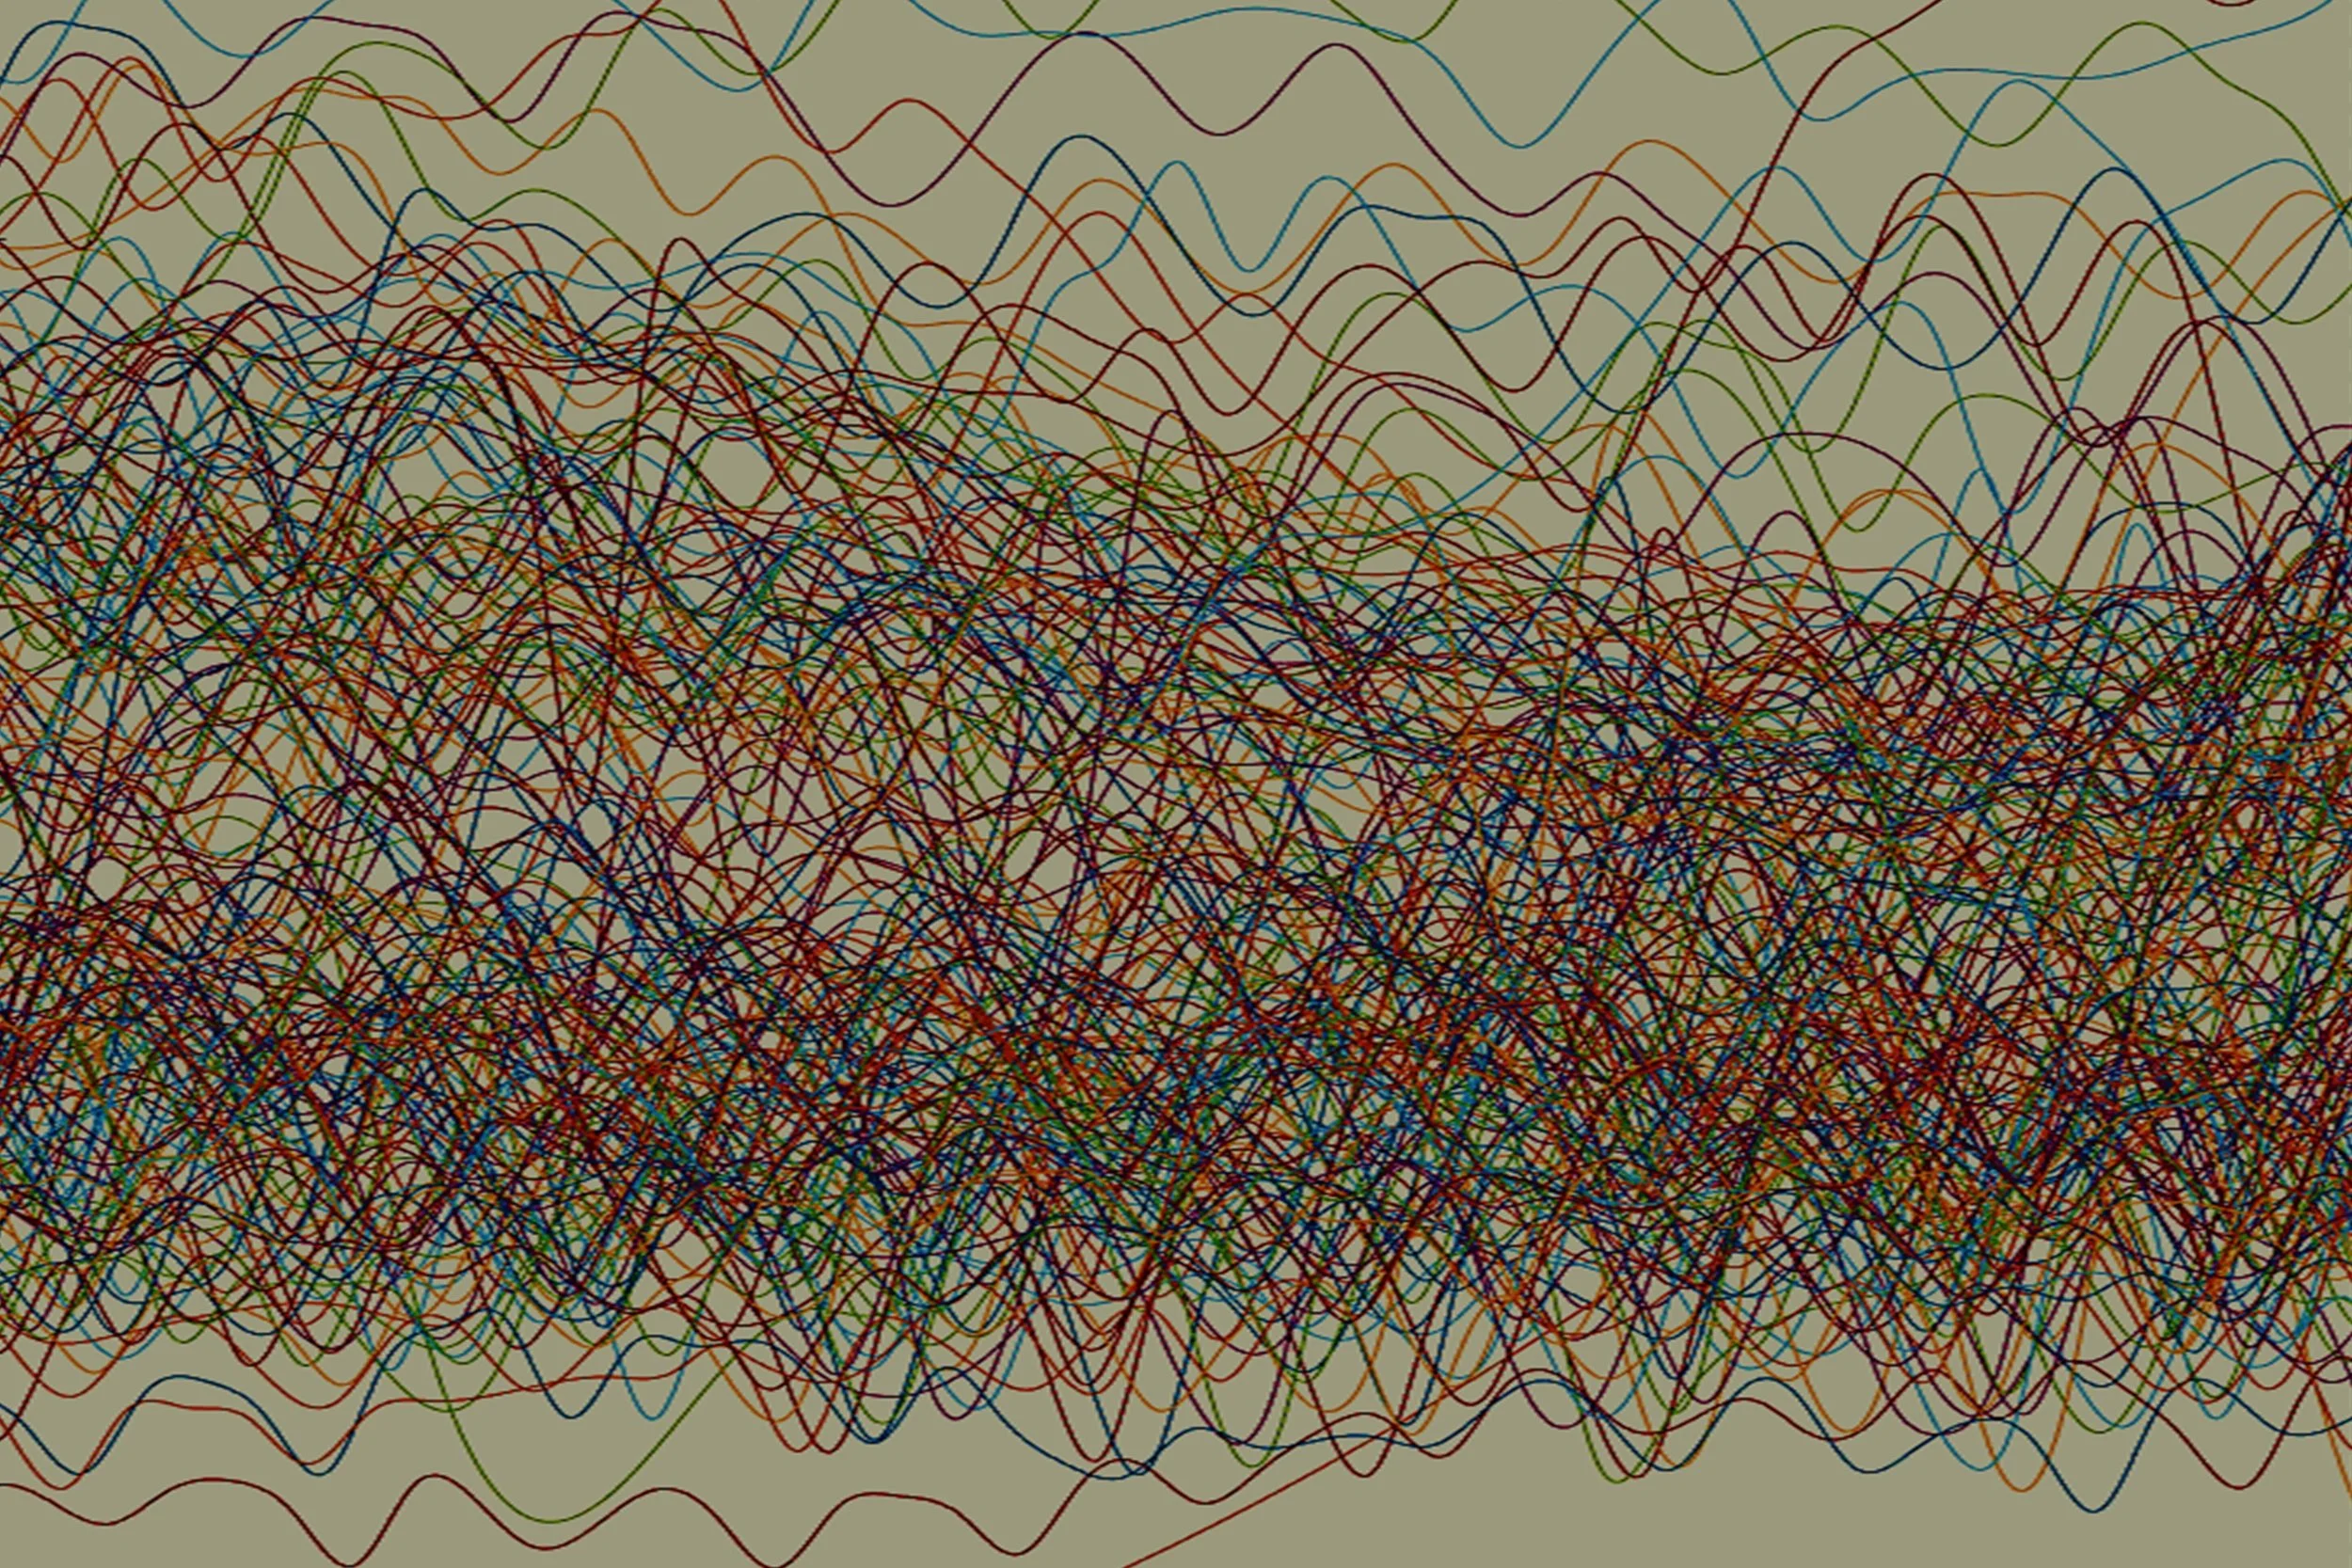
Aggregated Apnea SBP
Choking during sleep (sleep apnea) jacks up blood pressure just like choking while awake. This diptych presents two 30 second periods of systolic blood pressure data (one 30-s period per panel) from before and after the end of a sleep apnea event. BP signals from many patients are aggregated, colorized, and then further processed according to artistic license.
Transitional Month of Sleep
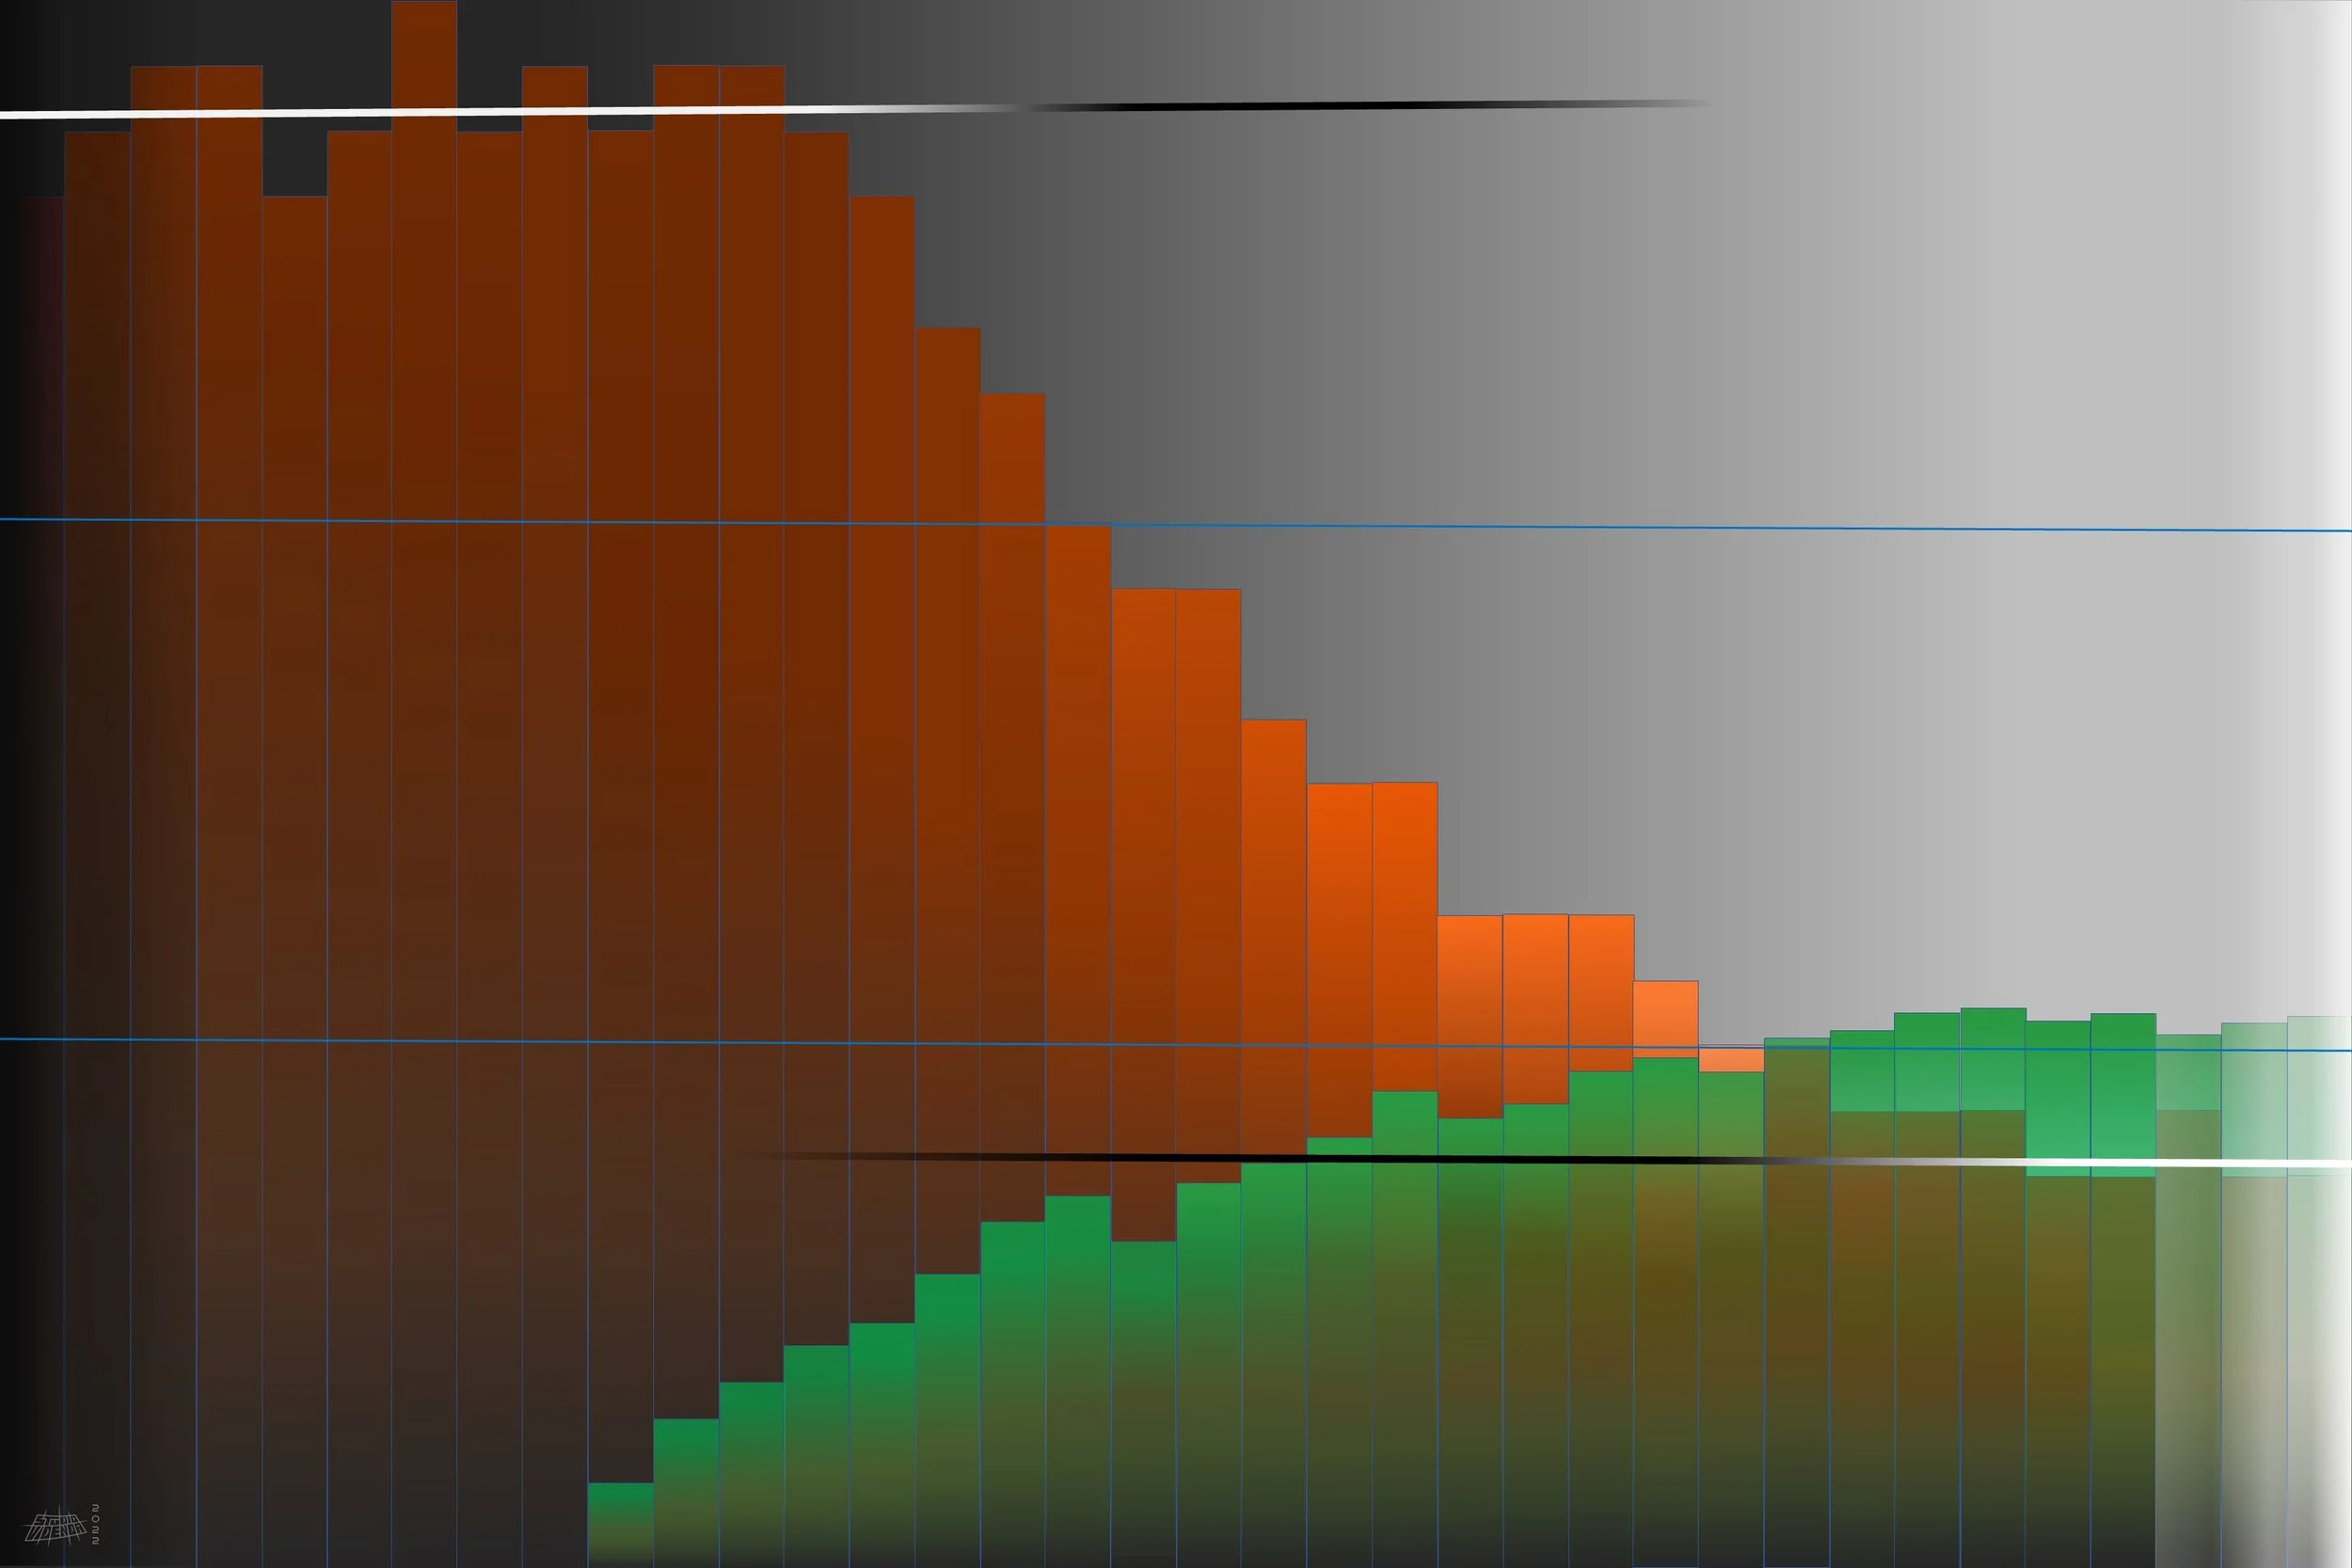
Treating sleep apnea with positive airway pressure therapy (PAP) wakes people up! This work shows 36 days of data (x-axis) from a patient with severe sleep apnea. They started using PAP on day 10, and they were using it all night by day 28. Vertical bars show daily sleepiness (Epworth Score; orange) and PAP usage (hours; green). Conveniently, both the Epworth Sleepiness Score and the number of hours per day are 24-unit scales (y-axis). Epworth Score interpretation:
0 – 8: normal healthy wakefulness;
9 – 12: mild sleepiness;
13 – 16: moderate sleepiness;
17 – 24: severe sleepiness.
Delta Waves
Large, low-frequency brainwaves called delta waves define stage N3 sleep, which is the deepest, highest quality sleep we can achieve. The brain generates these large waves by synchronizing bioelectrical activity between its core (thalamus) and surface (cortex). N3 sleep is not dream sleep, which is called REM. Children have a lot of N3 sleep, but we get less and less of it as we age.
Clueless About Sleep?
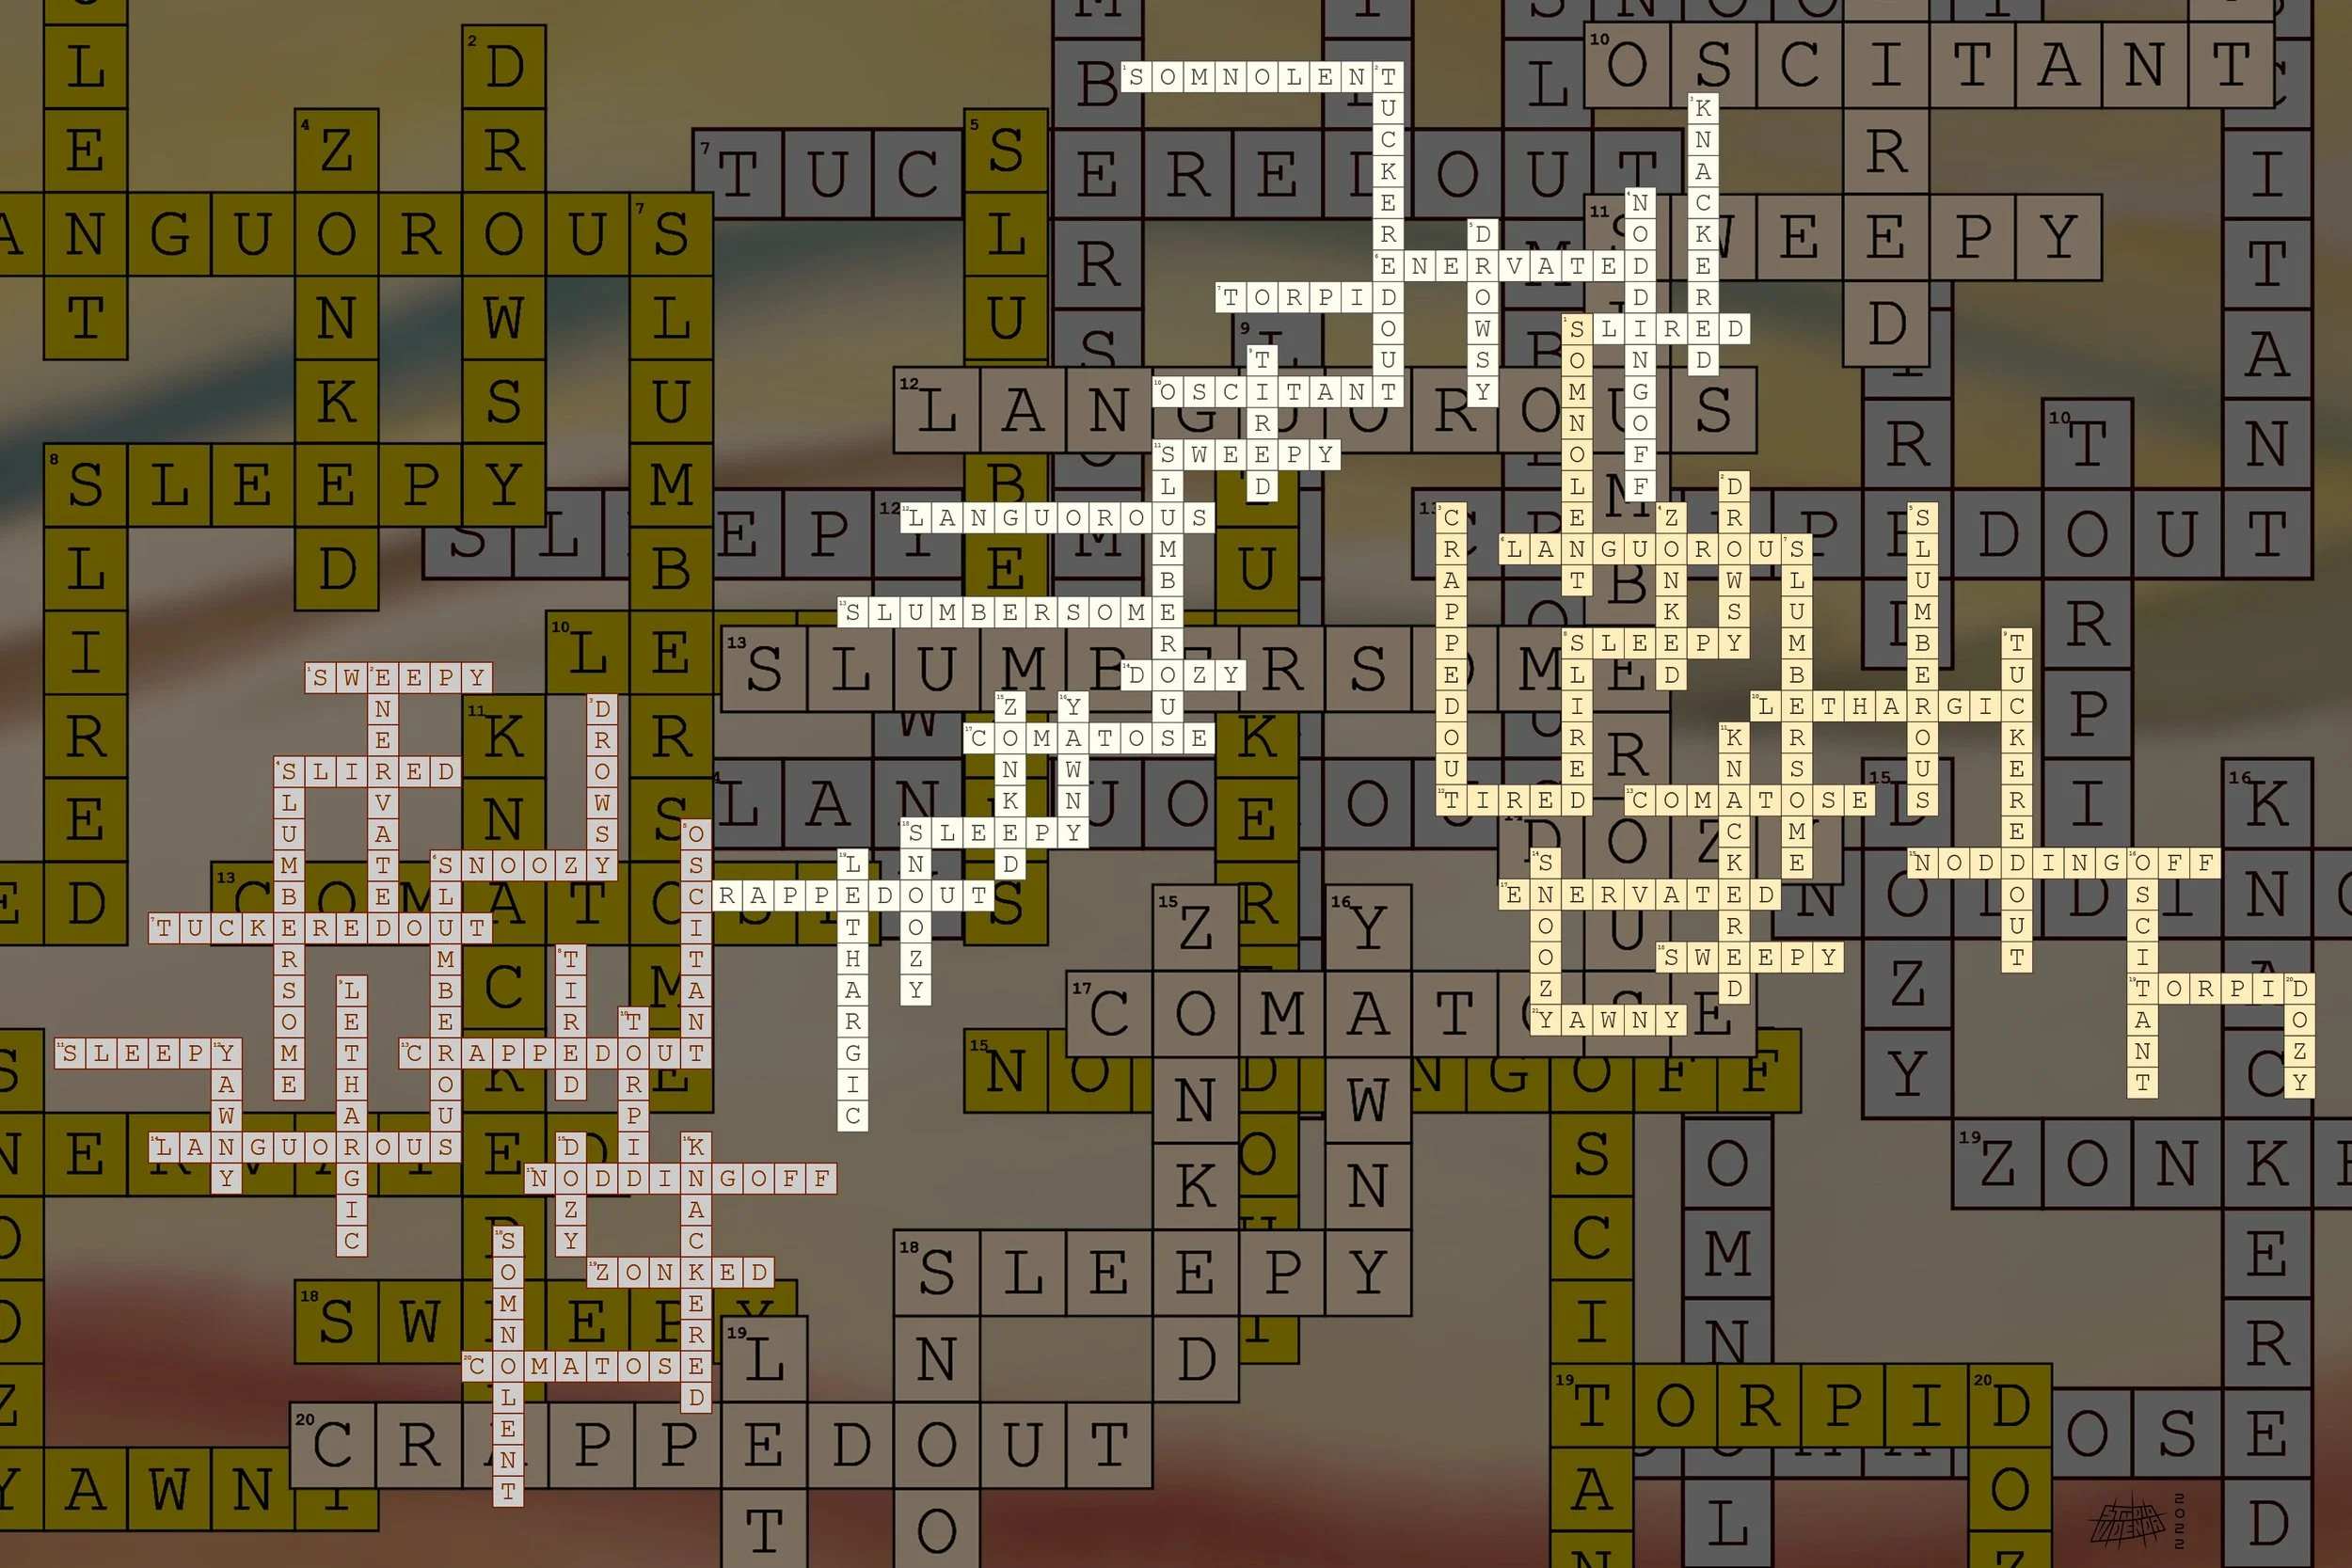
A crossword puzzle with answers but no clues? What if every answer is a clue? What if every answer was the clue for every other answer??


