
So what is data-driven art? It’s pretty much whatever you want it to be! It’s limited only by our imaginations. And when used properly, an imagination is infinite. Almost scary, huh?! No worries, one can quickly and easily dial down from infinite with a few quick questions.
Like, what is something important to you, or inspiring, or scary, funny, stupid, cool, disgusting, whatever, something you might want expressed artistically? This thing could be anything: a person, event, star cluster, song, company, neutron, golf game, … you get the idea. Whatever that thing is, it can be described, quantified, measured, in terms of numbers – data! And those numbers can be translated into art.
So I hear you asking: “Really? How exactly does this work? For example, emotions: how do you measure joy, or love, or fear, and then turn those numbers into art?” Great question! An example may help. Let’s try a data-driven artwork for love. More specifically, a young adult’s lovelife.

Romantic love seems like a tricky concept to capture in a piece of data driven art. Let’s see what we can do! | Photo by Kristina Litvjak on Unsplash
Let’s say someone loved 5 people romantically in life. They met and married “the one”, who they love more than anyone before. How much more? Can they look back at prior relationships and estimate how much they loved those people relative to how much they love their spouse now?
Let’s get detailed. Assuming they love their spouse 100% (?), they then estimate they loved their prior four partners at ~ 94, 76, 85, and 92%. Those five total relationships crossed ages 15 – 18, 19 - 20, 21 – 22, 22 - 23, and 25+. The subject ended the first and third relationships. The first partner was physically magnificent yet intensely dependent, the second really fun and loving but also unhealthy and emotive, the third seemed a great match but couldn’t drop some heavy “baggage”, the fourth extremely attractive yet never equally invested, and the fifth quiet and beautiful, inside and out.
So here we go. Age goes from left to right, 10 – 30 years, and love from bottom to top on a scale of 60 – 110%. A heart represents each partner, it’s vertical position (at the top edge) how much they were loved, it’s width the duration of love.
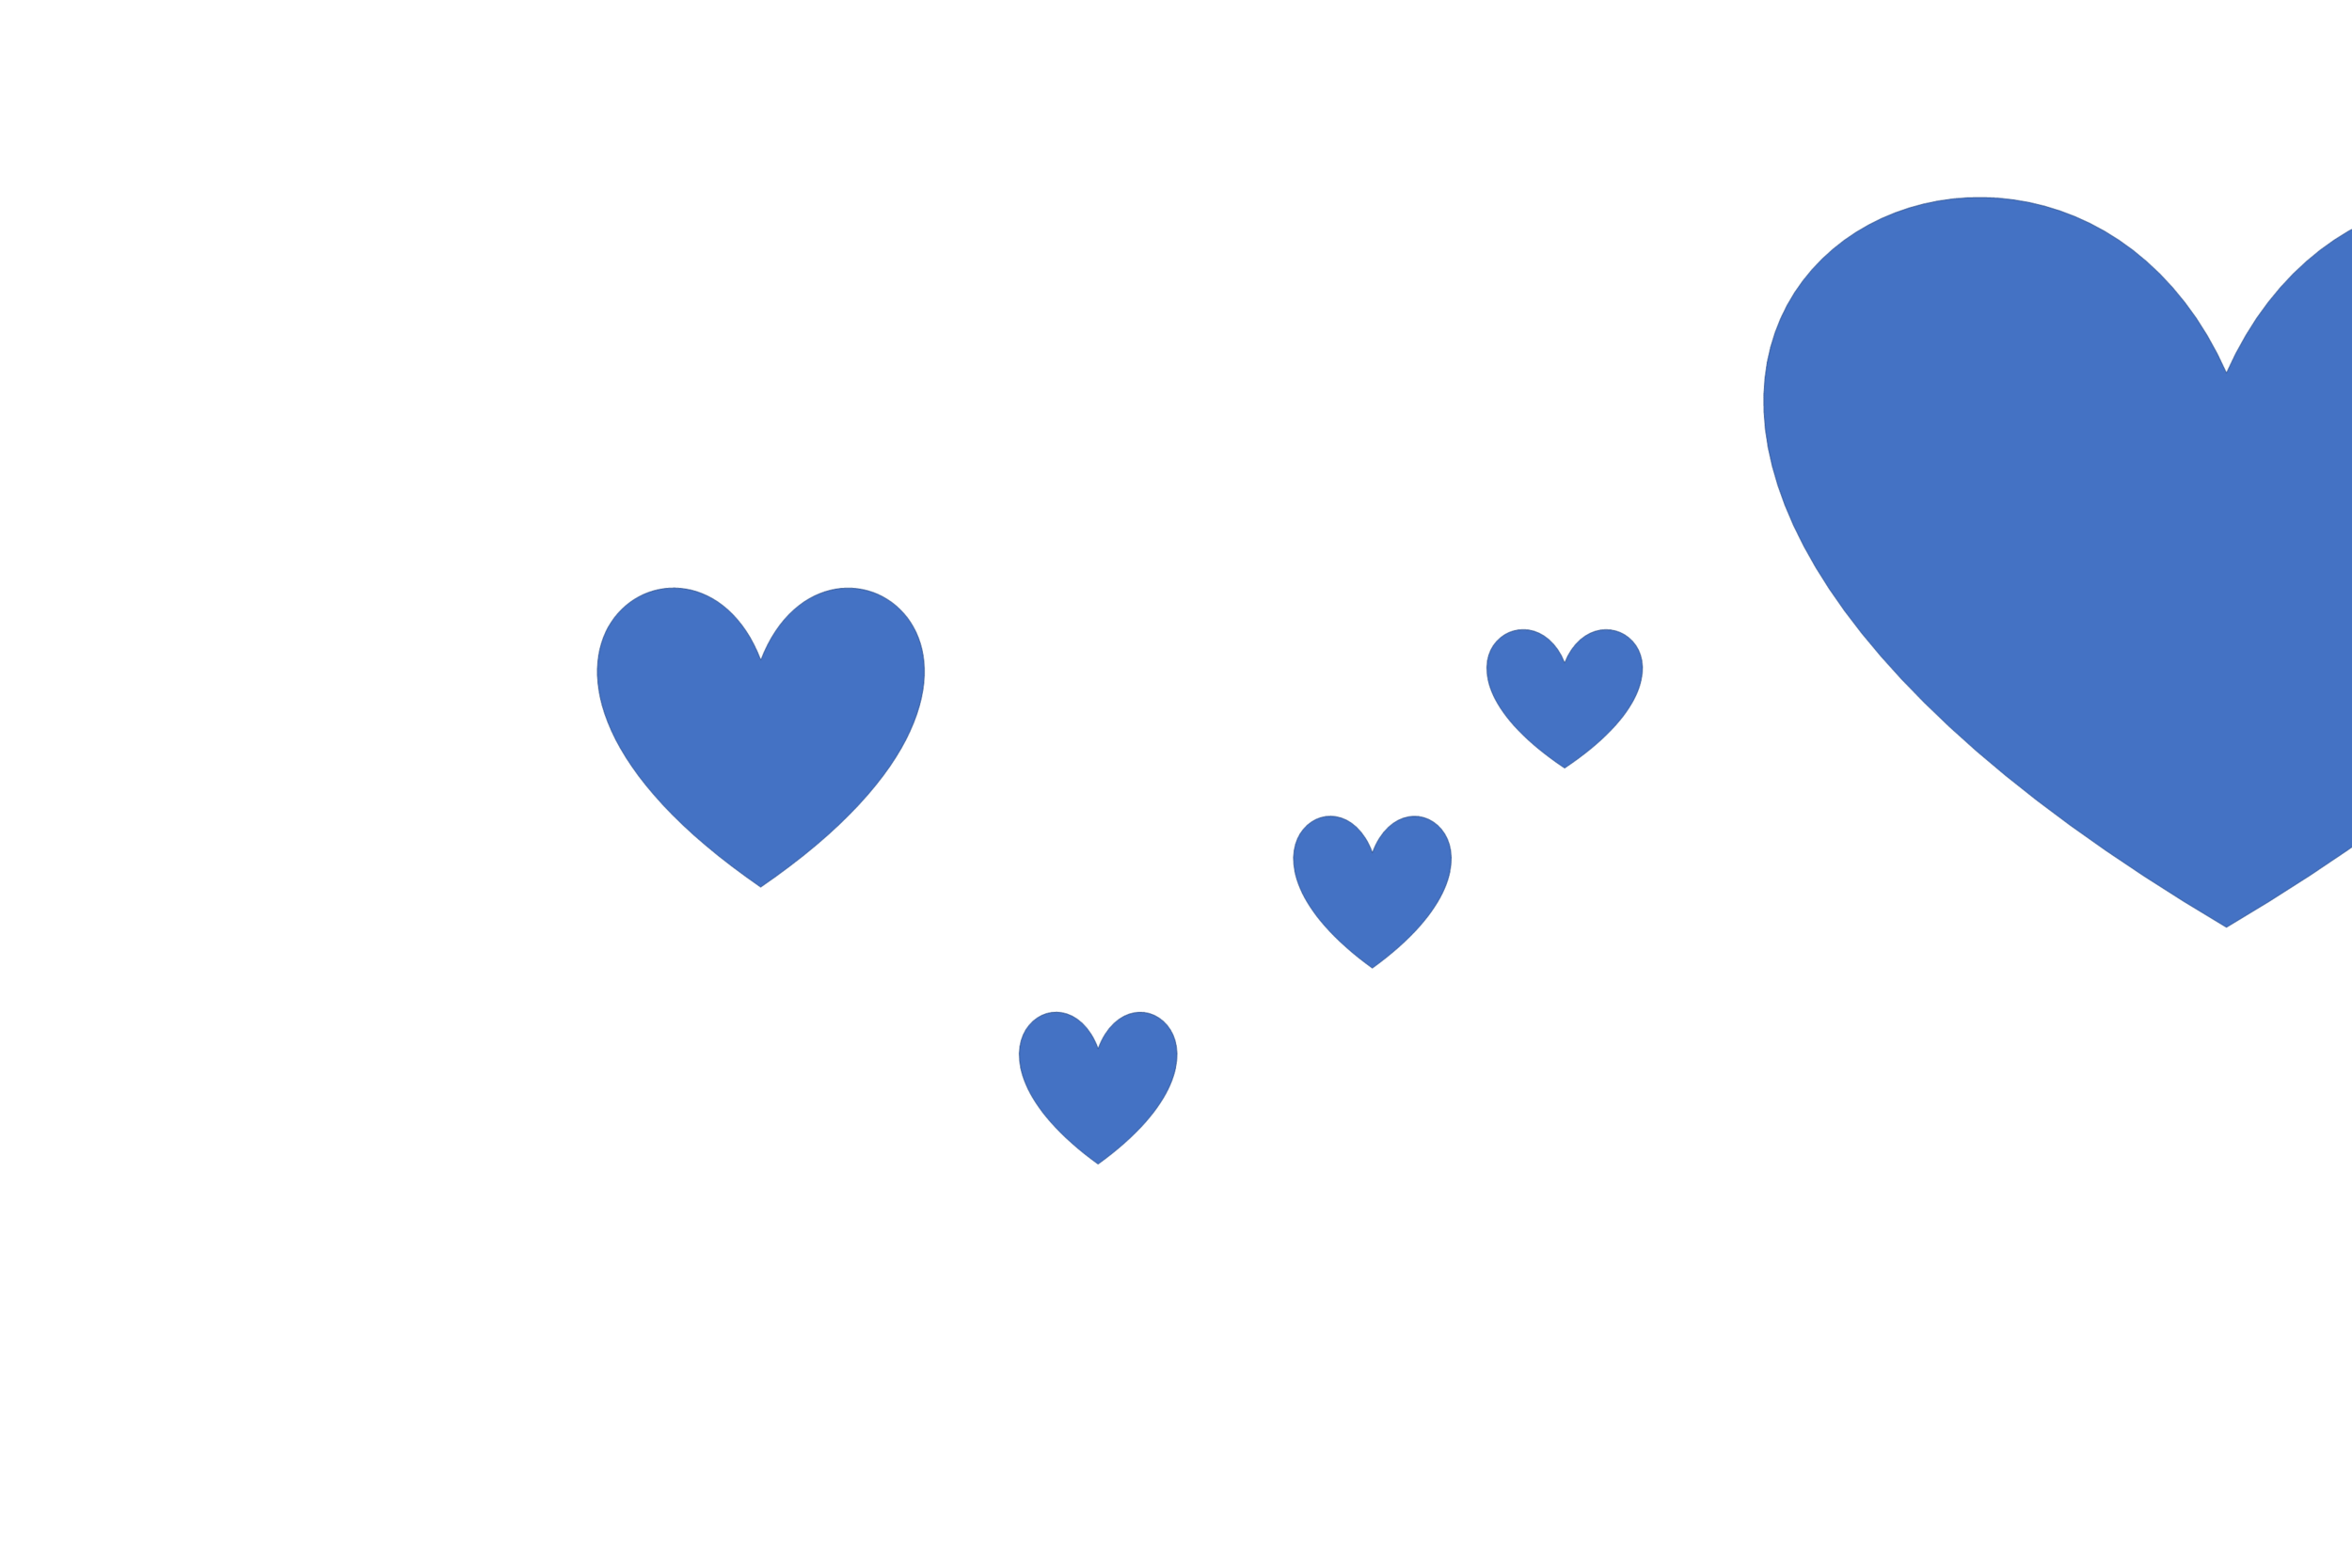
The position of the hearts represent how much each partner was loved and for how long.
However, many other aspects of the subject’s relationships could be shown. For example, what back-story do the shadows tell at the next step in the piece (below)? Each represents something about that relationship’s persistence in the primary subject’s lovelife, as follows:
· Shadowing above, below, or even with the heart: positive, negative, or neutral attitude towards future relationships, respectively;
· Size and transparency of the shadow: degree of impact on future relationships;
· Rightward reach of shadow: duration of impact;
· Color and blur: Complexity and uniqueness of the impact.

The borders and fill of the hearts combine with the shadows and positioning to tell a story. What story do you see?
The coloration of the heart borders represents a left-to-right timeline of the intensity and depth of love. (Note the first four borders end in black, and the overlap of borders between hearts 3 – 4.) Notice the colors and patterns filling each heart. Based on the descriptions above, what stories do you see?
The grayscale background placed as the last step in the process (below) represents the primary subject’s interest in having a relationship across time, with black being disinterested, and white being very interested. The left edge of the work shows the subject’s parent’s love for each other setting forth their child’s romantic experiences.

The final image artistically tells the story of a person’s romantic journey using almost 10 data sources.
Now you’ve seen the steps in the artistic progression from basic X – Y data-driven concept to final product embodying almost 10 variables. Why did we choose love for the example? Love is actually very difficult to describe and quantify. If we can create data-driven art to represent love, we can do it for anything!